Trade-Offs Getting Tougher: Problems Paying Medical Bills Increase for U.S. Families, 2003-2007
Tracking Report No. 21
September 2008
Peter J. Cunningham
About 57 million Americans were in families with problems paying medical bills in 2007—an increase of 14 million people since 2003, according to a new national study by the Center for Studying Health System Change (HSC). Problems paying medical bills increased for both nonelderly insured and uninsured people. Although the rate of medical bill problems is much higher for uninsured people, most people with medical bill problems—42.5 million—had insurance coverage. About 2.2 million people with medical bill problems were in families that filed for bankruptcy as a result of their medical bills, and a much larger number reported other financial consequences, such as problems paying for other necessities and having to borrow money. The increase in medical bill problems—especially among insured people—is the main reason why more people reported unmet medical needs because of cost in 2007 than in 2003.
- Medical Bill Problems Increase
- nonelderly Insured and Uninsured See Rise
- Insured Low-Income People Less Protected
- Amount, Duration of Medical Debt Varies
- Financial Fallout of Medical Bill Problems
- Medical Bill Problems and Access to Care
- Advice or Assistance From Medical Providers
- Implications
- Notes
- Data Source and Funding Acknowledgements
- Supplementary Tables
Medical Bill Problems Increase
![]() s health care costs continue to increase faster than incomes,
many families are paying higher out-of-pocket expenses for both health insurance
premiums and health care services.1 As a result, paying
for medical care has become more difficult than ever, likely leading many families
to make difficult financial trade-offs and increasingly forgo needed medical
care.
s health care costs continue to increase faster than incomes,
many families are paying higher out-of-pocket expenses for both health insurance
premiums and health care services.1 As a result, paying
for medical care has become more difficult than ever, likely leading many families
to make difficult financial trade-offs and increasingly forgo needed medical
care.
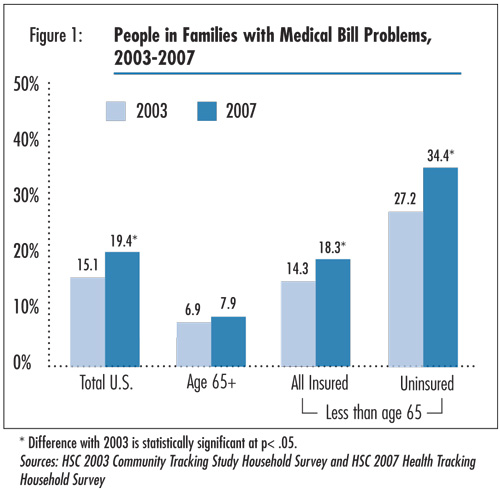
The percentage of Americans in families with problems paying medical bills increased from 15.1 percent in 2003 to 19.4 percent in 2007, according to HSC’s 2007 Health Tracking Household Survey (see Data Source and Figure 1).2 That translates to more than 57 million Americans of all ages in families in 2007 reporting problems paying medical bills in the previous 12 months—an increase of more than 14 million people since 2003.
Medical bill problems arise from a variety of health problems, but most people reported that medical bill problems resulted from family members’ illnesses (60.4%), while 28.6 percent of bill problems were related to an accident or injury (findings not shown). About 8 percent of people reported that their medical bill problems were caused by the birth of a child.
Click here to view this figure as a PowerPoint slide.
Nonelderly Insured and Uninsured See Rise
![]() he proportion of people with medical bill problems increased
for all nonelderly people, regardless of their type of insurance coverage or
whether they were uninsured. Underscoring uninsured people’s lack of financial
protection from health care expenses, the uninsured are more likely to be in
families with medical bill problems (34.4%) compared with insured people (18.3%).
More surprising is the relatively high rate (28.4%) of medical bill problems
among enrollees in Medicaid or other state coverage programs (see Supplementary
Table 1), although most of these people are poor or low income and, therefore,
are vulnerable to even small amounts of out-of-pocket costs.
he proportion of people with medical bill problems increased
for all nonelderly people, regardless of their type of insurance coverage or
whether they were uninsured. Underscoring uninsured people’s lack of financial
protection from health care expenses, the uninsured are more likely to be in
families with medical bill problems (34.4%) compared with insured people (18.3%).
More surprising is the relatively high rate (28.4%) of medical bill problems
among enrollees in Medicaid or other state coverage programs (see Supplementary
Table 1), although most of these people are poor or low income and, therefore,
are vulnerable to even small amounts of out-of-pocket costs.
By contrast, there were no increases in medical bill problems among people 65 and older, who almost all have Medicare coverage. Overall, elderly Medicare beneficiaries—especially those with supplemental private insurance coverage—have lower levels of medical bill problems compared with nonelderly people, despite the fact that elderly people use more health care and incur higher out-of-pocket expenses.3 This may reflect health care being a higher priority for elderly people and—compared with families with young children—fewer other financial obligations that require sacrificing other necessities, such as mortgage payments or rent, food and clothing.
Back to Top
Insured Low-Income People Less Protected
![]() he proportion of Americans with medical bill problems increased across all income levels between 2003 and 2007, including those with moderate and higher family incomes. Overall, the percentage of people with medical bill problems is higher among low-income people—31.8 percent in 2007 for those with incomes less than 200 percent of poverty, or $41,300 for a family of four in 2007, compared to 12.4 percent for people in families with incomes of 400 percent of poverty or higher.
he proportion of Americans with medical bill problems increased across all income levels between 2003 and 2007, including those with moderate and higher family incomes. Overall, the percentage of people with medical bill problems is higher among low-income people—31.8 percent in 2007 for those with incomes less than 200 percent of poverty, or $41,300 for a family of four in 2007, compared to 12.4 percent for people in families with incomes of 400 percent of poverty or higher.
This reflects both a higher proportion of low-income people who are uninsured and the fact that insurance coverage appears to make less of a difference in the rate of medical bill problems for low-income people. Among low-income people, 36.1 percent of the uninsured reported medical bill problems compared with 30 percent of the insured. For higher-income people, the uninsured were three times as likely to report medical bill problems (32.3%) compared with the insured (10.7%). Although a higher proportion of insured low-income people are covered by Medicaid and other public programs—which generally have less patient cost sharing than private coverage—even relatively small expenses may be a burden for low-income people.
Back to Top
Amount, Duration of Medical Debt Varies
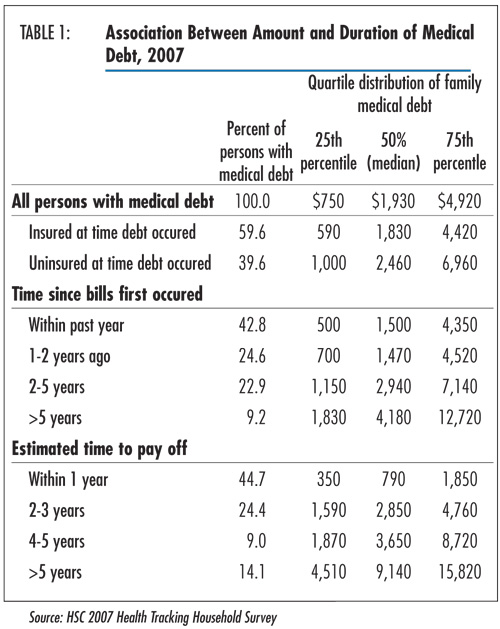
![]() ost people with medical bill problems in the prior year
still had medical debt at the time of their interview (90%). However, the amount
of medical debt varied considerably, ranging from about one-fourth who had debt
of less than $800 to one-fourth with debt of about $5,000 or more (see Table
1). About 10 percent had debt of $12,000 or more. Debt amounts were higher
for those who were uninsured at the time the debt was incurred compared with
those who were insured.
ost people with medical bill problems in the prior year
still had medical debt at the time of their interview (90%). However, the amount
of medical debt varied considerably, ranging from about one-fourth who had debt
of less than $800 to one-fourth with debt of about $5,000 or more (see Table
1). About 10 percent had debt of $12,000 or more. Debt amounts were higher
for those who were uninsured at the time the debt was incurred compared with
those who were insured.
The duration or expected duration of medical debt also varied considerably. Of those with medical debt, less than half (42.8%) had first incurred their debt within the past year, while about one-third incurred their debt two years ago or longer. Similarly, less than half (44.7%) expected to pay off their debt within the next year, while about one-fourth reported it will take four years or longer to pay off their debt.
Back to Top
Click here to view this figure as a PowerPoint slide.
Financial Fallout of Medical Bill Problems
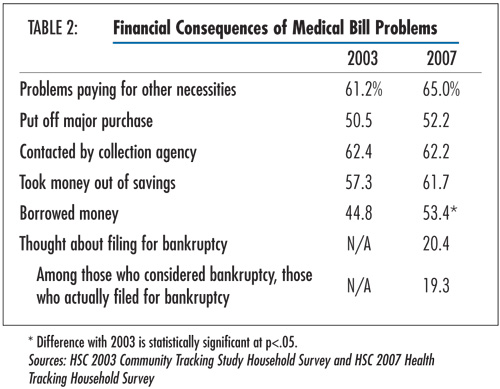
![]() n both 2003 and 2007, the majority of people in families
with problems paying medical bills were compelled to make difficult sacrifices
as a result, including two-thirds with problems paying for other necessities,
such as food, clothing, mortgage or rent, and more than half putting off major
purchases (see Table 2). Other financial consequences
included 62 percent being contacted by a collection agency, and more than half
borrowing money to pay medical bills.
n both 2003 and 2007, the majority of people in families
with problems paying medical bills were compelled to make difficult sacrifices
as a result, including two-thirds with problems paying for other necessities,
such as food, clothing, mortgage or rent, and more than half putting off major
purchases (see Table 2). Other financial consequences
included 62 percent being contacted by a collection agency, and more than half
borrowing money to pay medical bills.
In addition, one in five people with medical bill problems considered filing for bankruptcy because of medical bill problems. Of these, about 2.2 million people were in families that actually filed for bankruptcy because of medical bill problems, similar to estimates from other studies.4 Not surprisingly, larger debt levels prompted more people to consider bankruptcy; 38.6 percent of persons with medical debt of $5,000 or more considered filing for bankruptcy, compared with about 9 percent of those with debt of $1,000 or less (findings not shown).
Back to Top
Click here to view this figure as a PowerPoint slide.
Medical Bill Problems and Access to Care
![]() n 2007, about 10 percent of people with medical bill problems
reported being denied care by medical providers directly as a result of their
medical bills problems (findings not shown). However, many others failed to
obtain needed medical care because of worries about the cost of care. People
with medical bill problems—both insured and uninsured—reported much
higher levels of unmet medical needs in the previous year because of costs compared
with people without medical bill problems (see Supplementary
Table 2).
n 2007, about 10 percent of people with medical bill problems
reported being denied care by medical providers directly as a result of their
medical bills problems (findings not shown). However, many others failed to
obtain needed medical care because of worries about the cost of care. People
with medical bill problems—both insured and uninsured—reported much
higher levels of unmet medical needs in the previous year because of costs compared
with people without medical bill problems (see Supplementary
Table 2).
Moreover, financial barriers to care increased for insured people between 2003 and 2007, with the largest percentage increases occurring among insured people with medical bill problems (from 6.6% with unmet need because of cost in 2003 to 11.7 % in 2007). While uninsured people have much higher levels of unmet needs because of cost compared with insured people, this did not change between 2003 and 2007. Previous HSC research has shown that unmet medical needs for uninsured people increased for other reasons, primarily related to the health care system.5
As with the financial consequences of medical debt, the negative effects on access increase with the size and duration of medical debt. For example, a much higher percentage of people with debt of $5,000 or more reported unmet medical needs because of cost (19%) compared with those with debt of less than $500 (11.4%) (findings not shown).
Back to Top
Advice or Assistance From Medical Providers
![]() s cost increasingly becomes a barrier to care—including
among the insured—medical providers are likely to become more involved
in providing assistance or suggestions to patients who are trying to cope with
large medical bills and debt. Among people who reported problems paying medical
bills, more than half reported that their health care providers suggested a
payment plan to pay off the bills (see Supplementary Table 3).
s cost increasingly becomes a barrier to care—including
among the insured—medical providers are likely to become more involved
in providing assistance or suggestions to patients who are trying to cope with
large medical bills and debt. Among people who reported problems paying medical
bills, more than half reported that their health care providers suggested a
payment plan to pay off the bills (see Supplementary Table 3).
Much less frequently reported actions included providers offering a discount (16.2%), informing patients about sources of free care (6.8%) and public assistance (14.6%), suggesting that patients take out a loan (11.5%), and referring patients to another provider (7.1%).
However, when the association of these provider assistance measures with unmet medical needs was examined, only one of these actions—being informed about sources of free care—was associated with a lower level of unmet medical needs because of cost.6 Among those who were informed by their provider about sources of free medical care, 9.2 percent reported unmet medical needs because of cost compared with 14.7 percent of all people with medical bill problems.
Back to Top
Implications
![]() hese results confirm that rising health care costs in general—and out-of-pocket expenses in particular—are increasing the financial burden of health care on families, contributing to increased financial stress and often compelling them to sacrifice other important goods and services, including medical care. Moreover, increases in problems paying medical bills are affecting not only those who have always struggled with medical costs—low-income and uninsured people—but also an increasing number of insured middle-income families. Increases in problems paying medical bills undoubtedly reflect rising out-of-pocket costs for medical care. Rising fuel costs and other inflation, the home foreclosure crisis, and an expected economic downturn—whose full impact didn’t occur until 2008—also may have begun to increase financial pressures on families in 2007.
hese results confirm that rising health care costs in general—and out-of-pocket expenses in particular—are increasing the financial burden of health care on families, contributing to increased financial stress and often compelling them to sacrifice other important goods and services, including medical care. Moreover, increases in problems paying medical bills are affecting not only those who have always struggled with medical costs—low-income and uninsured people—but also an increasing number of insured middle-income families. Increases in problems paying medical bills undoubtedly reflect rising out-of-pocket costs for medical care. Rising fuel costs and other inflation, the home foreclosure crisis, and an expected economic downturn—whose full impact didn’t occur until 2008—also may have begun to increase financial pressures on families in 2007.
Recognizing that insurance coverage in and of itself may no longer be sufficient to protect many people from the high cost of health care, the affordability of health insurance coverage and health care is a key issue in many state and national reform proposals. Many policy proposals focus primarily on the affordability of health insurance premiums, calling for sliding-scale subsidies based on income levels. Fewer proposals emphasize tying deductible and copayment or coinsurance amounts to a person’s income level, even though these expenditures have increased in recent years and can result in serious financial burdens even for people who can afford to pay their premiums.7 One exception is the Massachusetts Commonwealth Care program, which includes sliding-scales premium subsidies and caps out-of-pocket spending for services based on a person’s income. Similarly, the State Children’s Health Insurance Program requires that total cost sharing (premiums, deductibles, copayments) not exceed 5 percent of family income.
However, there is no single accepted definition of affordability applied nationwide. In fact, disagreements over the issue of affordability were one of the reasons for the failure of the California health reform effort, which did not include any provisions to cap out-of-pocket spending for services.8 Setting affordability standards needs to balance both the impact on state budgets as well as the financial burden a family reasonably can be expected to bear. And affordability will vary depending on the financial health of state budgets, the relative cost-of-living in an area, the socioeconomic and health characteristics of the population, and the number of people already covered by health insurance.
Absent state or national reforms to make health care more affordable for families, more limited measures might include increasing awareness of and referrals to free or lower-cost sources of medical care, such as federally funded community health centers, which have expanded during this decade. Other HSC research indicates that most uninsured are unaware of sources of free or reduced-cost care in their community, and it is likely that awareness of such facilities is even lower among insured people with problems paying medical bills.9 The findings in this report indicate that provider referrals to free care sources are effective in reducing problems with access among people with medical bill problems, although very few of these patients actually receive such referrals. Programs such as Project Access that started in Buccombe County, N.C., and that have since been adopted by other communities around the nation, attempt to increase awareness and coordinate free sources of medical care in the community. This may provide at least some temporary relief and assistance to an increasing number of families who can no longer afford medical care through the mainstream health care system.
Back to Top
Notes
Back to Top
Data Source and Funding Acknowledgements
The data for this Tracking Report are from HSC’s 2007 Health Tracking Household Survey and the 2003 Community Tracking Study Household Survey. Both surveys are nationally representative telephone surveys of the U.S. population. The samples include about 47,000 persons for the 2003 survey and about 18,000 persons for the 2007 survey. Response rates for the surveys were 57 percent in 2003 and 43 percent in 2007. Population weights adjust for probability of selection and differences in nonresponse based on age, sex, race/ethnicity, and education. Questionnaire design and data collection methods were similar across both surveys. Information was obtained on all adults in the family as well as a randomly selected child. Although both surveys are nationally representative, the sample for the 2003 survey was clustered in 60 representative communities, while the 2007 survey was based on a stratified random sample of the nation. Standard errors account for the complex sample design of the surveys.
Both surveys asked the question, “During the past 12 months have you or your family had any problems paying medical bills?” This report takes the perspective that it is more appropriate to observe medical bill problems at the family-level because decisions on major expenses and finances—including medical care—are usually made at the family level. This also implies that the negative effects of medical bill problems in the family will affect all family members, rather than just the individual(s) within the family who incurred the medical bills. For this reason, the response to the question on medical bill problems—asked only once per family—are applied to all persons in the family. The estimates reflect the percent of persons in families with medical bill problems.
Funding Acknowledgements: Support for this research was provided by The Commonwealth Fund. The survey data used for the analysis was sponsored by the Robert Wood Johnson Foundation.
Back to Top
Supplementary Tables
Supplementary Table
1: People in Families with Medical Bill Problems, 2003 and 2007, by Health
Insurance Coverage
Supplementary Table 2:
Access Problems for People with Medical Bill Problems (ages less than 65)
Supplementary Table 3:
Advice and Assistance from Medical Providers in Response to Patients’ Medical
Bill Problems, 2007
TRACKING REPORTS are published by the
Center for Studying Health System Change.
600 Maryland Avenue, SW, Suite 550
Washington, DC 20024-2512
Tel: (202) 484-5261
Fax: (202) 484-9258
www.hschange.org