
Minneapolis-St. Paul: Health Care Market Overcomes Early State Resistance to National Reform
RWJF Reform Community Report
August 2013
Laurie E. Felland, Robert Mechanic, Amanda E. Lechner, Rebecca Gourevitch
![]() fter initial state government resistance to national health reform, the Minneapolis-St. Paul metropolitan area is well on the way to preparing for national health reform, according to a new Center for Studying Health System Change (HSC) study of the region’s commercial and Medicaid insurance markets (see Data Source). Shortly after passage of the federal Patient Protection and Affordable Care Act (ACA) in March 2010, former Gov. Tim Pawlenty (R) and the Republican-controlled state Legislature vowed to block implementation of many of the law’s key provisions. However, since electing Gov. Mark Dayton (D) later in 2010 and Democrats gaining control of the Legislature in 2012, Minnesota has proceeded with full ACA implementation.
fter initial state government resistance to national health reform, the Minneapolis-St. Paul metropolitan area is well on the way to preparing for national health reform, according to a new Center for Studying Health System Change (HSC) study of the region’s commercial and Medicaid insurance markets (see Data Source). Shortly after passage of the federal Patient Protection and Affordable Care Act (ACA) in March 2010, former Gov. Tim Pawlenty (R) and the Republican-controlled state Legislature vowed to block implementation of many of the law’s key provisions. However, since electing Gov. Mark Dayton (D) later in 2010 and Democrats gaining control of the Legislature in 2012, Minnesota has proceeded with full ACA implementation.
In March 2011, the state opted to expand Medicaid eligibility for childless adults with incomes up to 75 percent of the federal poverty level (FPL) and will implement the full Medicaid expansion in 2014. The Legislature approved creation of a state-run health insurance exchange in March 2013 known as MNsure. The exchange is expected to be ready for open enrollment Oct. 1, 2013. Key factors likely to influence how national health reform plays out in the Minneapolis-St. Paul area include:
- A robust economy supporting strong private health coverage. Buoyed by a large government presence and many Fortune 500 companies, the Twin Cities weathered the Great Recession better than many communities, with relatively few people losing jobs. Compared to other metropolitan areas, incomes and private health insurance rates are high in Minneapolis-St. Paul.
- A history of comprehensive public insurance programs. Minnesota offers several public insurance programs to children and adults with incomes higher than allowed in many states. MinnesotaCare supplements the traditional Medicaid program—called Medical Assistance—to provide limited benefits to people with higher incomes and new immigrants, including the many refugees who relocate to the Twin-Cities area.
- Average health insurance regulation. Minnesota falls in the middle of states in the degree of current regulation governing the individual—or nongroup—and small-group health insurance markets. Carriers are required to cover many types of benefits and face some rating restrictions. A longstanding high-risk pool covers thousands of people who are priced out of the nongroup market because of pre-existing health conditions.
- A relatively competitive insurance market with multiple local, nonprofit health plans. Stemming from a Minnesota law precluding for-profit health maintenance organizations (HMOs) from operating in the state, local nonprofit carriers Blue Cross Blue Shield of Minnesota, Medica, HealthPartners and PreferredOne divide the commercial insurance market, with market shares ranging from about 40 percent to 10 percent, respectively, in the metro area.
- An evolving health insurance product mix. While Minneapolis-St. Paul was known for strong gatekeeper-type HMOs in the 1980s and 1990s, preferred provider organizations (PPOs) have become the dominant product as consumers demanded more provider choice. Employers and consumers also have embraced high-deductible health plans (HDHPs). More recently, health plans have established tiered-network products that differentiate patient cost sharing depending on whether a provider is in a preferred tier.
- Tightly aligned hospitals and physicians in four systems. Allina, Fairview, HealthPartners and HealthEast, the major hospital systems in the market, now employ most of the area’s primary care physicians. With these integrated systems traditionally based in either St. Paul or Minneapolis, some are now crossing the Mississippi River to compete for patients.
- Plans and providers collaborating on innovative contracting. Despite significant provider consolidation, insurance carriers typically reported that, compared to other markets, provider contract negotiations with insurers tend to focus on improving care quality, coordination and efficiency rather than simply on gaining higher payment rates. Indeed, many providers have entered “total-cost-of care” contracts that include incentives to limit spending growth but stop short of global capitation.
- Restricted Medicaid health plan choices. While Minnesota law requires all HMOs to participate in the state‚Äôs public health insurance programs—Medicaid, the Children‚Äôs Health Insurance Program (CHIP) and MinnesotaCare—the state‚Äôs 2012 transition to competitive bidding eliminated one health plan in the Twin Cities area and changed the remaining health plans‚Äô service areas, requiring many enrollees to change plans.
- Lack of clarity about the structure and impact of the state insurance exchange. With the state insurance exchange still under development, respondents faced many unknowns about which commercial plans would participate. Many predicted significant premium increases in the nongroup market and changes in product offerings intended to control premium growth.
Table of Contents
Market Background
![]() lanking the Mississippi River, the Minneapolis-St. Paul metropolitan area is home to about 3.3 million people and includes 11 counties in Minnesota: Hennepin, Ramsey, Anoka, Sherburne, Wright, Carver, Scott, Isanti, Chisago, Washington and Dakota. The region also includes two counties in western Wisconsin, but this study focuses solely on the Minnesota portion of the region. Hennepin and Ramsey, the largest counties, are home to the Twin Cities of Minneapolis and St. Paul, respectively.
lanking the Mississippi River, the Minneapolis-St. Paul metropolitan area is home to about 3.3 million people and includes 11 counties in Minnesota: Hennepin, Ramsey, Anoka, Sherburne, Wright, Carver, Scott, Isanti, Chisago, Washington and Dakota. The region also includes two counties in western Wisconsin, but this study focuses solely on the Minnesota portion of the region. Hennepin and Ramsey, the largest counties, are home to the Twin Cities of Minneapolis and St. Paul, respectively.
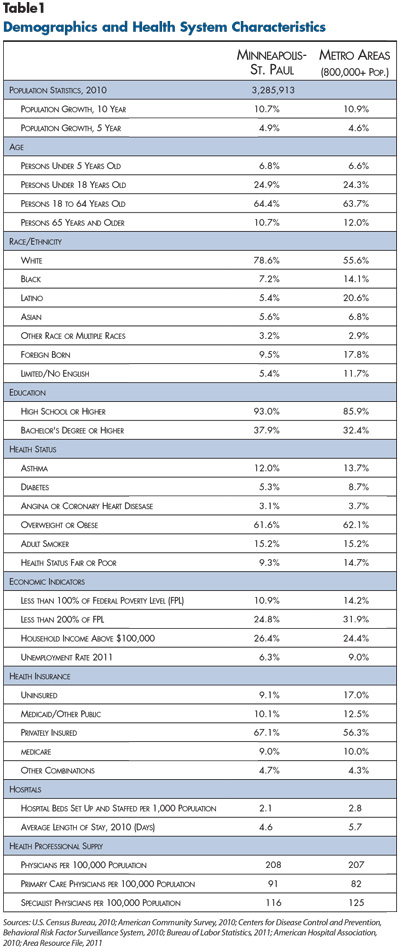
With a growth rate on par with the nation as a whole, area residents are highly educated relative to other metropolitan areas. The region has a much higher proportion of white, non-Latino residents (78.6%) compared to the metropolitan average of 55.6 percent (see Table 1). Residents have a low incidence of chronic diseases, including asthma and diabetes, as well as a lower rate of self-reported fair or poor health status when compared to other metropolitan areas.
The Twin Cities’ unemployment rate and proportion of low-income residents are below the U.S. average for metropolitan areas, in part, because of the presence of many large companies. In fact, Minnesota is home to more Fortune 500 companies per capita than any other state.1 Major private employers include Target Corp., 3M, Medtronic, U.S. Bank, UnitedHealth Group, as well as the major hospital systems. Also, with St. Paul as the state capital and the University of Minnesota based in the market, 13.5 percent of workers in the region are employed in public-sector jobs.2 Compared to other states, Minnesota has a smaller percentage of workers in firms with fewer than 50 workers (40% vs. 45% nationally).3 A growing technology sector has attracted venture capital, and the market has a number of smaller high-tech firms, such as medical device companies.
Largely because most employers offer health insurance, about two-thirds of Minneapolis-St. Paul residents have private coverage, compared to 55 percent for the nation as a whole. The region has among the lowest uninsurance rates in the country, with approximately 9 percent of residents lacking any type of health coverage, about half the average rate for metropolitan areas (17%). Still, the recession had a lingering negative impact, with the proportion of people covered by private insurance declining slightly between 2009 and 2011.4

State Regulatory Approach
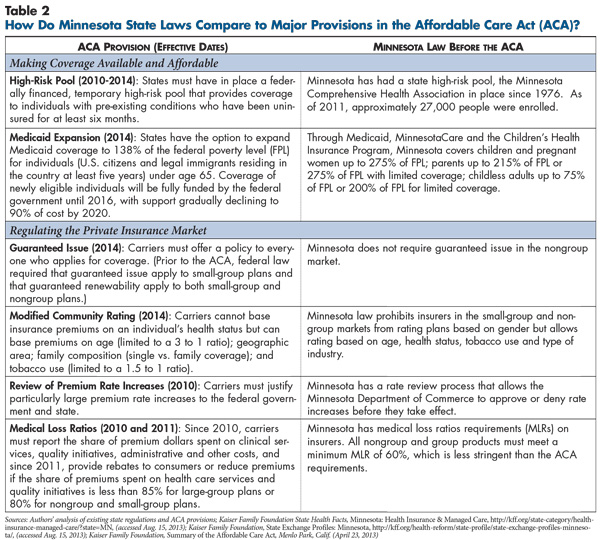
![]() innesota is viewed as having a moderate regulatory approach to the nongroup and small-group health insurance markets (see Table 2 and Table 3). The state mandates coverage of 65 benefits, more than most states, but excludes some costly mandates, such as coverage of comprehensive autism treatment and infertility treatment. Minnesota, like all states, requires guaranteed issue in the small-group market and guaranteed renewability in both the nongroup and small-group markets. In Minnesota, health plans are allowed to vary rates in the nongroup and small-group markets based on age, health status, tobacco use and industry but not on gender. All rate changes in the nongroup and small-group markets are subject to approval by the Minnesota Department of Commerce.
innesota is viewed as having a moderate regulatory approach to the nongroup and small-group health insurance markets (see Table 2 and Table 3). The state mandates coverage of 65 benefits, more than most states, but excludes some costly mandates, such as coverage of comprehensive autism treatment and infertility treatment. Minnesota, like all states, requires guaranteed issue in the small-group market and guaranteed renewability in both the nongroup and small-group markets. In Minnesota, health plans are allowed to vary rates in the nongroup and small-group markets based on age, health status, tobacco use and industry but not on gender. All rate changes in the nongroup and small-group markets are subject to approval by the Minnesota Department of Commerce.
Minnesota also operates one of the oldest and largest high-risk pools in the country, with 27,000 enrollees statewide. Established in 1976, the Minnesota Comprehensive Health Association is funded through health plan assessments and enrollee premiums, which are capped at 125 percent of the average nongroup market premium.5
Many Public Coverage Options
![]() innesota‚Äôs public insurance programs—Medicaid, CHIP and MinnesotaCare—provide coverage to people with higher incomes compared to most states. Implemented in 1992 as a state-only program, MinnesotaCare has received federal matching funds since 1995 through a federal waiver for certain qualified enrollees. MinnesotaCare enrollees typically pay modest monthly premiums and have more limited benefits than Medicaid/CHIP enrollees—for example, an annual $10,000 limit on inpatient hospital expenses. MinnesotaCare covers new legal immigrants ineligible for Medicaid and people with higher incomes. For example, Medicaid covers parents with incomes up to 215 percent of poverty, and MinnesotaCare covers parents with incomes from 215 percent to 275 percent of poverty. Under the ACA, which allowed states to expand Medicaid to nondisabled childless adults before 2014 with partial federal funding support, Minnesota moved childless adults with incomes up to 75 percent of poverty from MinnesotaCare to Medicaid, with MinnesotaCare continuing to cover childless adults with incomes up to 200 percent of poverty. A smaller state-only program, Healthy Minnesota, covers adults with incomes between 200 percent and 250 percent of poverty. In 2012, Medicaid/CHIP had a statewide average of 733,000 monthly enrollees and MinnesotaCare had 129,000.6
innesota‚Äôs public insurance programs—Medicaid, CHIP and MinnesotaCare—provide coverage to people with higher incomes compared to most states. Implemented in 1992 as a state-only program, MinnesotaCare has received federal matching funds since 1995 through a federal waiver for certain qualified enrollees. MinnesotaCare enrollees typically pay modest monthly premiums and have more limited benefits than Medicaid/CHIP enrollees—for example, an annual $10,000 limit on inpatient hospital expenses. MinnesotaCare covers new legal immigrants ineligible for Medicaid and people with higher incomes. For example, Medicaid covers parents with incomes up to 215 percent of poverty, and MinnesotaCare covers parents with incomes from 215 percent to 275 percent of poverty. Under the ACA, which allowed states to expand Medicaid to nondisabled childless adults before 2014 with partial federal funding support, Minnesota moved childless adults with incomes up to 75 percent of poverty from MinnesotaCare to Medicaid, with MinnesotaCare continuing to cover childless adults with incomes up to 200 percent of poverty. A smaller state-only program, Healthy Minnesota, covers adults with incomes between 200 percent and 250 percent of poverty. In 2012, Medicaid/CHIP had a statewide average of 733,000 monthly enrollees and MinnesotaCare had 129,000.6
Home-Grown Health Plan Competition
![]() he Minneapolis-St. Paul health insurance market is controlled by four local, nonprofit health plans: Blue Cross Blue Shield of Minnesota, Medica, HealthPartners and PreferredOne. National for-profit carriers, such as UnitedHealth Group and Cigna, have a limited role in the market, generally serving as third-party administrators for self-insured employers.
he Minneapolis-St. Paul health insurance market is controlled by four local, nonprofit health plans: Blue Cross Blue Shield of Minnesota, Medica, HealthPartners and PreferredOne. National for-profit carriers, such as UnitedHealth Group and Cigna, have a limited role in the market, generally serving as third-party administrators for self-insured employers.
A Minnesota law allowing only nonprofit HMOs to operate in the state contributes to the limited presence of for-profit carriers. Historically HMOs were popular products, and while PPO products have surpassed HMOs in popularity, respondents reported that national carriers still face barriers to entering the small and mid-sized group market because the local carriers have strong reputations and market clout. While for-profit United is based in suburban Minneapolis, it does not sell insurance products in the state but does provide some administrative functions for Medica. Also, HealthPartners has access to the Cigna national provider network when enrollees require out-of-state services.
Blue Cross is the largest insurer in the Twin Cities, with about 40 percent of the commercial market, including the self-insured market where it can provide a national provider network through the Blue Card program. Blue Cross also has the largest share of the nongroup market.
HealthPartners controls 20 percent to 25 percent of the commercial market, reportedly increasing market share in recent years, in part, by offering lower premiums than other carriers. HealthPartners is the largest carrier in the small-group market and second in the large-group market, including a strong government business segment. Along with serving as an insurance carrier, HealthPartners operates many medical and dental outpatient clinics7 and Regions Hospital, the level 1 trauma center and major safety net hospital in St. Paul.
However, HealthPartners is not a closed system: its health plan members have access to non-HealthPartners providers, and other health plans contract with HealthPartners providers. Services to enrollees in the health plan reportedly account for about 40 percent of HealthPartners’ medical group revenue. Drawing on approaches from its medical group, HealthPartners also works closely with contracted providers to implement strategies to control costs and improve quality more broadly.
Medica controls about 20 percent to 25 percent of the commercial market and has a strong presence in the small-group market. PreferredOne has about 10 percent market share and concentrates on large self-insured employers.
Product offerings tend to be largely similar across carriers. One broker reported that the carriers tend to adopt each other’s innovations rapidly: “When it comes to plan design, all the carriers have one or two innovative ideas, but mostly when one plan rolls one out, all the other carriers react and incorporate the same idea.” A health plan executive concurred, reporting a “fast following” of product development from one plan to the next.
Brokers play a central role in health insurance sales to small and mid-sized groups in the Twin Cities. Respondents, including health plan executives, regarded brokers as major actors in the market who encourage employer adoption of innovative products. While they play an important role in the employer market, brokers traditionally have not focused on the nongroup market.
High-Deductible Health Plans Popular
![]() espite being an HMO-based marketplace in the 1980s and 1990s, Minneapolis-St. Paul has moved primarily to PPO products, including high-deductible health plans tied to tax-advantaged accounts for medical expenses.
espite being an HMO-based marketplace in the 1980s and 1990s, Minneapolis-St. Paul has moved primarily to PPO products, including high-deductible health plans tied to tax-advantaged accounts for medical expenses.
Respondents reported that Minneapolis-area employers traditionally have offered comprehensive health benefits to employees. Health insurance premiums in Minnesota historically have been lower than average, in part, because providers are relatively efficient as indicated by low average hospital length of stay, for example, and the population is relatively healthy. However, over the last decade, premiums have increased relative to the national average and are now slightly above the national average.8 Also, small-group premiums have increased at a faster rate than the national average.9
In response, employers are adopting benefit designs that shift more costs to workers and attempt to control overall spending. Respondents indicated that, in typical small-group plans, employees face individual deductibles of $500 to $1,000, along with 20 percent to 25 percent coinsurance for many services and $25 copayments for physician office visits.
More small employers self-insure in this market, with about 18 percent of small-groups—fewer than 50 workers—opting to self-insure, compared to about 11 percent nationally.10 Respondents indicated that many small companies in the area are relatively sophisticated, perhaps enabling them to assume and manage the financial risk of enrollees‚Äô care. Further, many respondents reported that smaller and smaller groups are switching to self-insurance, in part, to avoid paying state taxes on fully insured products.
Alongside traditional PPO products, both large and small employers typically offer at least one HDHP with a lower premium. Minneapolis-St. Paul employers were early adopters of HDHPs, and respondents indicated that up to 30 percent of commercially insured workers are in HDHPs across the large- and small-group markets. Typical HDHP deductibles range from $2,500 to $3,000 for single coverage but vary across group size, and employers commonly contribute to health savings accounts (HSAs) or health reimbursement arrangements (HRAs). By comparison, 19 percent of workers nationwide were enrolled in an HDHP with a savings option in 2012.11 Respondents attributed HDHP acceptance to an engaged employer community and a workforce willing to make cost/quality trade-offs when choosing providers.
Integrated Delivery Systems Collaborate with Health Plans
![]() ver time, most hospitals and physician groups in the Twin Cities have consolidated into four care systems: Allina Health, Fairview Health Services, HealthPartners and HealthEast Care System. Together Allina and Fairview account for more than half of the inpatient discharges in the market, and both have large employed physician groups.12 With nine hospitals, Allina has broad geographic coverage across the metropolitan region. Fairview Health Services in Minneapolis has seven hospitals and more than 2,000 physicians, including the University of Minnesota Hospitals and Clinics, the Amplatz Children’s Hospital and the university’s 700 faculty physicians. HealthEast serves St. Paul and surrounding eastern suburbs. HealthPartners’ facilities are located throughout the metro area but predominately on the east side.
ver time, most hospitals and physician groups in the Twin Cities have consolidated into four care systems: Allina Health, Fairview Health Services, HealthPartners and HealthEast Care System. Together Allina and Fairview account for more than half of the inpatient discharges in the market, and both have large employed physician groups.12 With nine hospitals, Allina has broad geographic coverage across the metropolitan region. Fairview Health Services in Minneapolis has seven hospitals and more than 2,000 physicians, including the University of Minnesota Hospitals and Clinics, the Amplatz Children’s Hospital and the university’s 700 faculty physicians. HealthEast serves St. Paul and surrounding eastern suburbs. HealthPartners’ facilities are located throughout the metro area but predominately on the east side.
While most large multi-specialty physician practices have long been affiliated with one of these systems, most primary care physicians in Minneapolis-St. Paul reportedly are now employed by the systems as well. Still, small single-specialty groups have consolidated, with several large (80-100 physician) independent single-specialty groups now serving the market. Some respondents expected these groups increasingly to align with systems over time.
While the major hospital systems traditionally have served either Minneapolis or St. Paul, competition is increasing as providers cross the Mississippi River and enter each other’s turf to broaden their service areas. In a key recent example, respondents pointed to HealthPartners’ January 2013 merger with the smaller Park Nicollet Health Services, which serves Minneapolis and the affluent western suburbs. The combination of HealthPartners with Park Nicollet’s approximately 25 physician clinics and one hospital created one of the largest physician organizations in the Twin Cities with broad coverage of the metro area.
Unlike in some markets, the health systems in the Twin Cities have not pressed health plans for large payment rate increases: several respondents reported rates rising 2 percent to 4 percent annually in recent years. Additionally, respondents reported price variation across the major systems is more limited than in many markets.
Another factor reportedly keeping payment rates in check is the significant level of price and quality information available in the market. Delivery systems, health plans and state government jointly have established a standardized set of quality and cost metrics, and data are collected and published by the nonprofit Minnesota Community Measurement organization. The public reports rank hospitals, medical groups and clinics on a broad range of quality and patient-experience measures, as well as the relative rates insurers pay different providers for a range of common services. Respondents noted that this information creates healthy competition among hospital systems as employers and health plans use these outcome measures in choosing provider networks. As one health plan executive said, providers have “nowhere to hide” if their quality scores or prices are out of line.
Customizing Provider Networks
![]() ompared to many markets, Minneapolis-St. Paul employers and health plans actively attempt to steer members to “higher-performing” providers by placing the major delivery systems in tiers and requiring higher patient cost sharing to see providers in nonpreferred tiers. These tiered-network products are largely sold in the large-group market. In a key example, the state’s public employee health plan has an established four-tier benefits program with differing deductibles and coinsurance depending on an enrollee’s choice of provider system.
ompared to many markets, Minneapolis-St. Paul employers and health plans actively attempt to steer members to “higher-performing” providers by placing the major delivery systems in tiers and requiring higher patient cost sharing to see providers in nonpreferred tiers. These tiered-network products are largely sold in the large-group market. In a key example, the state’s public employee health plan has an established four-tier benefits program with differing deductibles and coinsurance depending on an enrollee’s choice of provider system.
Health plans also are developing ways for firms of all sizes to offer employees opportunities to make cost and quality trade-offs by customizing their coverage through different benefit designs and provider networks. In some cases, employers provide employees with a defined premium contribution, meaning employees will pay more or less depending on whether they select more economical or more costly options. For example, employees in firms offering Medica’s My Plan use their fixed contribution to select from a range of benefit options and provider networks through an online portal. In contrast to tiered products, narrow-network products have not gained much traction in the market given the demand for provider choice.
Total-Cost-of-Care Contracting
![]() nother distinctive feature of the Minneapolis-St. Paul market is the growing use of total-cost-of-care (TCC) contracts between the major health plans and provider systems that limit annual payment growth and include substantial pay-for-performance incentives. Similar to accountable care organization (ACO) payment models, TCC contracts emerged in the Twin Cities about five years ago and predate Medicare ACOs authorized by the ACA. Indeed, the major provider systems in Minneapolis also participate in Medicare ACOs. The TCC contracts are used in PPO products with enrollees attributed to a health system based on historical utilization patterns, although patients can still access care from providers outside of the designated system. One health plan executive estimated that total-cost-of care contracts represent more than 70 percent of the plan’s total medical spending in the Twin Cities, while an executive at another plan said about 40 percent of its business was in such contracts.
nother distinctive feature of the Minneapolis-St. Paul market is the growing use of total-cost-of-care (TCC) contracts between the major health plans and provider systems that limit annual payment growth and include substantial pay-for-performance incentives. Similar to accountable care organization (ACO) payment models, TCC contracts emerged in the Twin Cities about five years ago and predate Medicare ACOs authorized by the ACA. Indeed, the major provider systems in Minneapolis also participate in Medicare ACOs. The TCC contracts are used in PPO products with enrollees attributed to a health system based on historical utilization patterns, although patients can still access care from providers outside of the designated system. One health plan executive estimated that total-cost-of care contracts represent more than 70 percent of the plan’s total medical spending in the Twin Cities, while an executive at another plan said about 40 percent of its business was in such contracts.
Individual contracts vary in the level of risk borne by providers. Typically the provider systems are paid on a per-case basis for hospital care and a fee schedule for professional services, but health plans track overall spending, and there are contract incentives to manage overall costs of care for a defined patient population. Some contracts tie annual payment increases to a system’s recent performance on total costs and quality. Others are structured as shared-savings arrangements, and a growing number are placing providers at risk for reaching defined targets. Some plan executives suggested that over time some of these arrangements may evolve toward prospective global capitation payments.
Medicaid Managed Care Shake-Up
![]() innesota public coverage programs have long made heavy use of managed care, with approximately 85 percent of Medicaid enrollees and all MinnesotaCare enrollees in risk-based managed care arrangements. Disabled people, those needing long-term care, and those dually eligible for Medicaid and Medicare are exempt from mandatory managed care but can enroll in specialized Medicaid managed care plans.
innesota public coverage programs have long made heavy use of managed care, with approximately 85 percent of Medicaid enrollees and all MinnesotaCare enrollees in risk-based managed care arrangements. Disabled people, those needing long-term care, and those dually eligible for Medicaid and Medicare are exempt from mandatory managed care but can enroll in specialized Medicaid managed care plans.
Historically, Minnesota required all commercial HMOs to participate in Medicaid/CHIP and MinnesotaCare. No carrier dominated the Medicaid market, and plans with the largest enrollment in descending order were Medica, UCare (a plan serving only Medicaid and Medicare enrollees), HealthPartners and Blue Cross Blue Shield. Respondents indicated that health plans offered similar products for public programs, with some differentiation in enrollee incentives, provider networks, quality scores and customer service. As in the commercial market, the gatekeeper model in Medicaid HMOs has fallen by the wayside, allowing enrollees to obtain care without referrals or significant prior-authorization requirements. At the same time, the state has a patient-centered medical home initiative—known as health care homes—that financially supports primary care providers, in addition to regular fee-for-service payments, to improve care coordination across care settings.
However, in January 2012, in response to budget shortfalls and provider allegations about inadequate payment from plans, the state moved to competitive bidding for public programs in the core seven-county Minneapolis metropolitan area. The state based selection of health plans approximately half on their premium bids and half on other factors, including provision of various services, performance on quality indicators and adequacy of provider networks.13
Competitive bidding reduced the number of participating health plans, with HealthPartners and UCare now the only plans available throughout the entire Minneapolis/St. Paul metro area. However, the region’s largest counties, Hennepin, Dakota and Ramsey, each have three plans, with Medica remaining in Hennepin County and Blue Cross Blue Shield in Ramsey and Dakota. Because of the changes, UCare gained about 40,000 to 50,000 enrollees and HealthPartners gained 14,000, while Medica and Blue Cross lost enrollment. By April 2013, UCare had a 45-percent market share, with Medica and Health Partners each with about 25-percent market share.14 Metropolitan Health Plan, a Medicaid plan owned by major safety net provider Hennepin County Medical Center, lost its contract.
While all HMOs were required to bid, reportedly some health plans viewed the changes as a way to pare back their Medicaid role. As one respondent said, “[Commercial plans] want to be players; they want to have some Medicaid population but they don’t want too much Medicaid. They try to balance that.”
An estimated 85,000 enrollees—almost a third of the region‚Äôs total managed care population—had to switch plans. Respondents noted that outreach organizations and health plans had to make enrollees aware of the changes, and that transitions were cumbersome because of an outdated enrollment system. However, disruptions in care reportedly were few because providers typically participate with multiple health plans.
Indeed, compared to other markets, respondents reported strong physician participation in public programs. As one market observer said, “I haven’t heard of any issues where an enrollee calls a primary care clinic and they don’t take Medicaid.” Respondents indicated that health plans’ commercial and Medicaid provider networks are quite similar except that Medicaid provider networks include more community health centers and fewer dentists. One respondent said that provider network overlap has increased because the bidding process required plans to have broader networks.
Medicaid plans are starting to pursue ACO arrangements. UCare reportedly is starting to enter risk-bearing contracts with providers, initially with specific goals, such as reducing emergency department use. Further, respondents indicated the state is interested in adopting the total-cost-of-care model for Medicaid. Minnesota is implementing a three-year demonstration referred to as Health Care Delivery Systems. Six Medicaid provider ACOs were approved in January 2013. The Medicaid health plans are mandated to participate and contract with these entities. Providers and health plans share in any savings; gradually these entities will need to share any losses as well.15 In addition, the state has a federal grant to implement the Minnesota Accountable Health Model, with aims of increasing the types of care offered through ACOs, such as long-term and behavioral health services for both public and private payers.
Preparing for Health Reform
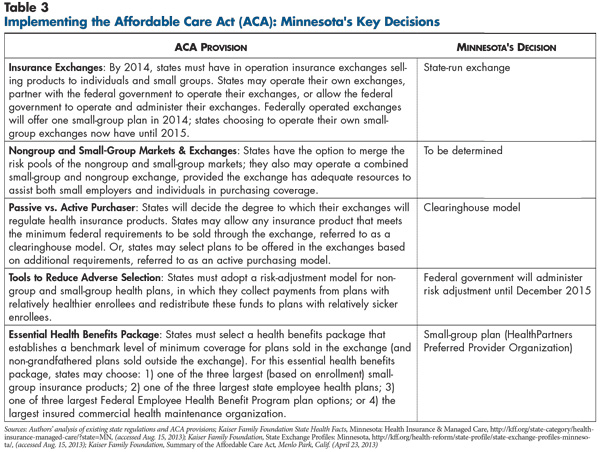
![]() ith Minnesota late to enact legislation creating the state insurance exchange and open enrollment scheduled for Oct. 1, 2013, the degree of uncertainty in Minneapolis-St. Paul about reform’s impact was significant. Minnesota’s exchange will operate under a clearinghouse model for 2014, meaning that all health plans meeting minimum federal standards can sell products through the exchange. Under the state’s exchange law, the exchange board may operate as an active purchaser beginning in 2015, meaning it could select plans to participate in the exchange using, for example, affordability and quality standards.
ith Minnesota late to enact legislation creating the state insurance exchange and open enrollment scheduled for Oct. 1, 2013, the degree of uncertainty in Minneapolis-St. Paul about reform’s impact was significant. Minnesota’s exchange will operate under a clearinghouse model for 2014, meaning that all health plans meeting minimum federal standards can sell products through the exchange. Under the state’s exchange law, the exchange board may operate as an active purchaser beginning in 2015, meaning it could select plans to participate in the exchange using, for example, affordability and quality standards.
Across the country, there are likely to be similar questions and concerns about setting premiums for products offered in the exchange, including:
- Risk pools—how sick will the newly insured be compared to the currently insured? Will young and healthy enrollees drop out because of higher rates and instead pay the tax penalty? Which small groups will drop coverage and how will this affect the risk pool?
- Pent-up demand—will the newly insured make up months and years of forgone care by using large amounts of medical care?
- Expanded benefits—how much utilization will occur, and how much will premiums increase because ACA minimums exceed benefits of many existing plans, especially in the nongroup market?
- Risk adjustment—how will the health status of enrollees be measured, and how will funds be redistributed among carriers? Will this process adequately account for differences in risk profiles of plan members?
Along with these broader concerns, there are some ways these issues could play out more specifically in the Minneapolis-St. Paul market.
Anxiety about setting rates. Respondents did not know definitively whether the major carriers in the market would participate in the exchange. Several plan executives predicted national carriers, such as United, Aetna and Cigna, might enter the market in 2014. The exchange presents an opportunity for national carriers to offer products other than HMOs by creating a new distribution channel to compete with the nonprofit local carriers for nongroup and small-group business.
Health plan executives expected they would need to increase nongroup premiums considerably and were concerned about state approval of their proposed rates. According to health plan executives, nongroup rates currently are low relative to the small-group market because carriers can deny coverage for pre-existing conditions, are only prohibited from rating on gender, and the most popular plans in the individual market cover “a very skinny set of benefits,” as described by one health plan respondent. New ACA modified community rating rules and the essential health benefits requirement will assure significant changes. Also, moving the 27,000 people in the high-risk pool into the exchange is expected to drive up average costs significantly. However, others pointed to an analysis conducted for the state that estimates reform provisions will increase nongroup premiums on average by 29 percent, but that subsidies will offset higher premiums, with an end result that consumers’ costs will decrease an estimated 20 percent on average.16
Respondents also expected new modified community rating rules to drive up small-group premiums because carriers will no longer be able to rate small groups based on workers‚Äô health status. However, the analysis done for the state predicted little impact on small-group premiums, primarily because the state already adopted some modified community rating provisions, and the essential health benefits package selected by the state—a HealthPartners PPO—is not significantly more comprehensive than current plans.
Focus on new products. Health plans and employers appeared set for further adoption of innovative insurance products as a way to offset expected premium increases and to avoid the 2018 excise tax on high-cost health benefits. Some respondents predicted an increasing prevalence of high-deductible plans and tiered-network products, with large cost-sharing differentials between preferred and nonpreferred providers. Others expected carriers would develop narrow-network products that sharply limit choice of providers. For example, one plan executive said a narrow-network could cut a projected 30 percent premium increase to 15 percent. Several respondents predicted more employers, primarily smaller ones, would adopt defined-contribution approaches where employees receive a fixed amount to choose from a menu of carriers’ products or potentially purchase coverage through the state exchange.
Maintaining coverage for low-income people. In part because Minnesota already partially expanded Medicaid and previously enacted MinnesotaCare, it has relatively fewer uninsured people than most other states.
However, MinnesotaCare can‚Äôt continue in its current form in 2014 because the benefit structure does not meet ACA standards—specifically the $10,000 cap on inpatient hospital care. To preserve affordable coverage for this group, the state plans to transform MinnesotaCare into a Basic Health Plan, an ACA option for states to provide a public form of subsidized coverage for people between 139 percent and 200 percent of poverty starting in 2015.17 According to a Medicaid plan respondent, this approach would offer lower premiums and cost sharing compared with subsidized exchange coverage, with the federal government contributing 95 percent of the costs it would have paid if this population enrolled in the state insurance exchange.
Fewer concerns about churn. Churn, or the movement of people between public coverage and subsidized private coverage because of changing income levels, may be less of a concern in Minnesota than in other states because there is considerable overlap between commercial and Medicaid carriers. For instance, HealthPartners is now a significant player in both markets and plans to operate in the exchange. Also, UCare, which does not currently operate in the commercial market, plans to offer private products in and outside the exchange in 2014 as a way to maintain continuity of coverage for people moving between public and private coverage. It’s difficult to know how the new Medicaid contracts will play out; on the one hand, there is now just one Medicaid-only plan, but on the other hand, some large commercial plans no longer have much of a Medicaid presence.
While the state will have navigators to help people enroll, select plans and minimize gaps in coverage, navigator organizations had not yet been identified, and there is some tension between outreach organizations and brokers about how to share the navigator role. Some brokers are attempting to gain a larger presence in the nongroup segment by marketing their services to individuals. Brokers were concerned that the exchange may not value brokers as much as carriers traditionally have and that their commissions will be limited.
Issues to Track
- Will Minnesota’s relatively strong economy and long-standing commitment to expanding coverage help smooth the transition to national reform and achieve near-universal coverage?
- How much more provider consolidation will occur and with what impact on care coordination? Will health plan-provider relationships remain collaborative?
- How rapidly will new payment arrangements shift risk to provider groups and how successful will they be in containing costs? How will the Medicaid program’s foray into these arrangements compare with or impact arrangements in the commercial market?
- Will national, for-profit insurance carriers participate in the exchange and be able to break into the nongroup and small-group markets dominated by local health plans? If so, what impact will there be on local nonprofit carriers, provider rate negotiations and product types? Will the state choose to be more involved in these decisions in 2015?
- How much will premiums for healthy and young people increase as the state implements modified community rating and people in the high-risk pool shift to the nongroup market? To what degree will federal premium subsidies offset higher premiums for healthy individuals?
- Will high-deductible health plans and limited-network products grow and edge out more traditional PPOs? To what extent will current products need to change to comply with ACA requirements?
- To what extent will employers opt to offer employees defined contributions to purchase coverage directly through commercial carriers or the state insurance exchange?
- What approach will the state take in contracting with Medicaid managed care plans going forward? How will that affect competition between managed care plans and managing care for people who transition between public and private coverage?
- How will the high-risk pool enrollees be shifted to the nongroup market and how many will enroll in public coverage, the exchange and/or purchase coverage in the individual market outside of the exchange? What impact will this change have on the risk profile of the market?
Notes
| 1. | Minnesota Department of Employment and Economic Development, Fortune 500 Companies, http://www.positivelyminnesota.com/Business/Locating_in_Minnesota/Major_Companies_Employers/Fortune_500_Companies.aspx (accessed July 10, 2013). |
| 2. | Authors’ calculation. U.S. Bureau of Labor Statistics, Economy at a Glance: Minneapolis-St. Paul-Bloomington, MN-WI (Dec 2012), http://www.bls.gov/eag/eag.mn_minneapolis_msa.htm (accessed July 10, 2013). |
| 3. | U.S. Bureau of Labor Statistics, Quarterly Census of Employment and Wages, Table 4, Private Industry by Supersector and Size of Establishment: Establishments and Employment, First Quarter 2011, by State, http://www.bls.gov/cew/ew11table4.pdf (accessed on July 10, 2013). |
| 4. | Minnesota Department of Health, Distribution of Minnesota Population by Primary Source of Insurance Coverage, 2003 to 2010, http://www.health.state.mn.us/divs/hpsc/hep/chartbook/section2.pdf (accessed July 10, 2013). |
| 5. | Enrollee premiums and the health plan assessment fees cover approximately equal parts of the Minnesota Comprehensive Health Association budget, http://mchamn.com/benefit-plans/ (accessed July 10, 2013). |
| 6. | Minnesota Department of Human Services, Medical Assistance, http://www.dhs.state.mn.us/main/idcplg?IdcService=GET_DYNAMIC_CONVERSION&RevisionSelectionMethod=LatestReleased&dDocName=id_006254 (accessed July 10, 2013). |
| 7. | In Minnesota, the term “clinic” is commonly used to refer to outpatient/ambulatory care facilities, both physician practices that primarily serve privately-insured people as well as community health centers and other safety net facilities that primarily serve Medicaid enrollees and uninsured people. |
| 8. | State Health Access Data Assistance Center, State-Level Trends in Employer-Sponsored Health Insurance, Minneapolis, Minn. (April 2013). |
| 9. | In Minnesota between 2003 and 2011, small group single premiums rose 69% (compared to 44% on average nationwide) and family premiums rose 57% (compared to 51% on average nationwide). Large group single premiums rose 42% (compared to 52% nationwide) and family premiums rose 53% (compared to 63% nationwide). Schoen, Cathy, et al., State Trends in Premiums and Deductibles, 2003-2011: Eroding Protection and Rising Costs Underscore Need for Action, The Commonwealth Fund, New York, N.Y. (December 2012). |
| 10. | Fronstin, Paul, Self-Insured Health Plans: State Variation and Recent Trends by Firm Size, Employee Benefit Research Institute, Washington, D.C. (November 2012). |
| 11. | Kaiser Family Foundation, 2012 Employer Health Benefits Survey Section 8: High-Deductible Health Plans with Savings Option, http://kff.org/report-section/ehbs-2012-section-8/ (accessed July 10, 2013). |
| 12. | HealthLeaders InterStudy, Market Overview: Minneapolis, Nashville, TN (November 2011). |
| 13. | Spencer, Donna, Kristin Dybdal and Katherine Johnson, Stakeholder Analysis of Medicaid Competitive Bidding in Minnesota, State Health Access Data Assistance Center, Minneapolis, Minn. (Oct. 8, 2012). |
| 14. | Authors’ analysis of enrollment data. Minnesota Department of Human Services, Managed Care Purchasing and Payment Policy, Minnesota Health Care Programs Managed Care Enrollment Totals: April 2013, Minneapolis, Minn. (April 4, 2013). |
| 15. | Houston, Rob, and Tricia McGinnis, Adapting the Medicare Shared Savings Program to Medicaid Accountable Care Organizations, Technical Assistance Brief, Center for Health Care Strategies, Inc., Hamilton, N.J. (March 2013). |
| 16. | Gruber, Jonathan, The Impact of the ACA and Exchange on Minnesota, report for the Minnesota Department of Commerce (April 2012), http://mn.gov/commerce/insurance/images/ExchGruberGormanFinalReport4-12.pdf (accessed July 10, 2013). |
| 17. | Minnesota Department of Human Services, “Commissioner Jesson Statement on HHS Basic Health Plan Announcement,” News Release (Feb. 6, 2013). |
Data Source
As part of the Robert Wood Johnson Foundation’s (RWJF) State Health Reform Assistance Network initiative, the Center for Studying Health System Change (HSC) examined commercial and Medicaid health insurance markets in eight U.S. metropolitan areas: Baltimore; Portland, Ore.; Denver; Long Island, N.Y.; Minneapolis/St. Paul; Birmingham, Ala.; Richmond, Va.; and Albuquerque, N.M. The study examined both how these markets function currently and are changing over time, especially in preparation for national health reform as outlined under the Patient Protection and Affordable Care Act of 2010. In particular, the study included a focus on the impact of state regulation on insurance markets, commercial health plans’ market positions and product designs, factors contributing to employers’ and other purchasers’ decisions about health insurance, and Medicaid/state Children’s Health Insurance Program (CHIP) outreach/enrollment strategies and managed care. The study also provides early insights on the impact of new insurance regulations, plan participation in health insurance exchanges, and potential changes in the types, levels and costs of insurance coverage.
This primarily qualitative study consisted of interviews with commercial health plan executives, brokers and benefits consultants, Medicaid health plan executives, Medicaid/CHIP outreach organizations, and other respondents—for example, academics and consultants—with a vantage perspective of the commercial or Medicaid market. Researchers conducted 18 interviews in the Minneapolis-St. Paul market between January and April 2013. Additionally, the study incorporated quantitative data to illustrate how the Baltimore market compares to the other study markets and the nation. In addition to a Community Report on each of the eight markets, key findings from the eight sites will also be analyzed in two publications, one on commercial insurance markets and the other on Medicaid managed care.