Community Report No. 06
Winter 2001
Kelly Devers, Jon B. Christianson, Laurie E. Felland, Suzanne Felt-Lisk, Liza Rudell, J. Lee Hargraves
- Hospitals Compete Aggressively in Certain Clinical Service Lines
- Freestanding Ambulatory Surgery Centers Reignite Controversy
- Physicians Move to Increase Leverage with Plans and Hospitals
- Hospitals Negotiate Small Payment Increases from Plans
- Health Plans Raise Employers Premiums
- Employers Take Modest Steps in Response to Premium Increases
- Care and Coverage Improves for the Uninsured
- Issues to Track
- Lansings Experience with the Local Health System, 1997 and 1999
- Background and Observations
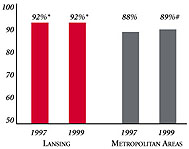
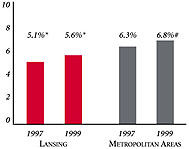
PERSONS SATISFIED WITH THE HEALTH CARE THEY RECEIVED IN THE LAST 12 MONTHS | PERSONS WHO DID NOT GET NEEDED MEDICAL CARE IN THE LAST 12 MONTHS |
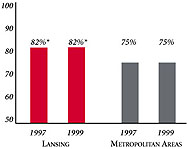
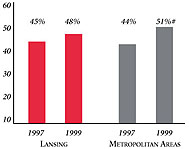
PHYSICIANS AGREEING THAT IT IS POSSIBLE TO PROVIDE HIGH-QUALITY CARE TO THEIR PATIENTS | PERSONS WITH INSURANCE THAT REQUIRES GATEKEEPING |
|
Lansing Demographics | |
Lansing | Metropolitan areas above 200,000 population |
Population, July 1, 19991 450,789 |
|
Population Change, 1990-19992 | |
4.2% | 8.6% |
Median Income3 | |
$30,830 | $27,843 |
Persons Living in Poverty3 | |
11% | 14% |
Persons Age 65 or Older3 | |
10% | 11% |
Sources: 1. US Bureau of Census, 1999 Community Population Estimates 2. US Bureau of Census, 1990 & 1999 Community Population Estimates 3. Community Tracking Study Household Survey, 1998-1999 |
Health Insurance Status | |
Lansing | Metropolitan areas above 200,000 population |
Persons under Age 65 with No Health Insurance1 | |
8.2% | 15% |
Children under Age 18 with No Health Insurance1 | |
4.0% | 11% |
Employees Working for Private Firms that Offer Coverage2 | |
85% | 84% |
Average Monthly Premium for Self-Only Coverage under Employer-Sponsored Insurance2 | |
$183 | $181 |
Sources: 1. Community Tracking Study Household Survey, 1998-1999 2. Robert Wood Johnson Foundation Employer Health Insurance Survey, 1997 |
Health System Characteristics | |
Lansing | Metropolitan areas above 200,000 population |
Staffed Hospital Beds per 1,000 Population1 | |
2.2 | 2.8 |
Physicians per 1,000 Population2 | |
2.1 | 2.3 |
HMO Penetration, 19973 | |
41% | 32% |
HMO Penetration, 19994 | |
41% | 36% |
Sources: 1. American Hospital Association, 1998 2. Area Resource File, 1998 (includes nonfederal, patient care physicians, except radiologists, pathologists and anesthesiologists) 3. InterStudy Competitive Edge 8.1 4. InterStudy Competitive Edge 10.1 |