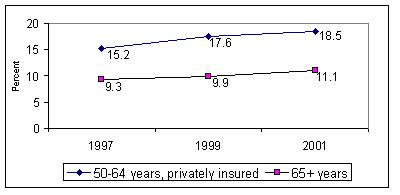
Percent Reporting Delaying or Not Receiving Needed Care in Past Year, Comparison of Medicare Beneficiaries and Privately-Insured Near Elderly
Note: Data from the Community Tracking Study (CTS) Household Surveys, 1996-7, 1998-9 and 2000-1.

Testimony
Feb. 28, 2002
Thank you Madam Chairman, Congressman Stark, and members of the committee for inviting me to testify about Medicare physician payment. I am Paul Ginsburg, President of the Center for Studying Health System Change (HSC). HSC is an independent nonpartisan policy research organization funded solely by The Robert Wood Johnson Foundation. Our longitudinal surveys of households and physicians and site visits to 12 communities provide a unique perspective on the private health care market.1 Although we seek to inform policy with timely and objective analyses, we do not lobby or advocate for any particular policy position.
Access for Medicare Beneficiaries
The goal of Medicare physician payment policy is to assure beneficiaries’ access to high quality care while meeting federal budget objectives. Problems with the Medicare physician payment update formula and the recent 5.4 percent fee cut have raised questions about the likely impact on access to care for Medicare beneficiaries. Our research suggests that Medicare beneficiaries’ access to care over time may depend on physician capacity and local market conditions, factors that are difficult to capture within a budget-driven payment formula. By physician capacity, I mean the ability of physicians to provide services relative to the demand for those services. Capacity depends on a range of factors, including physician supply, the amount of time physicians are willing to devote to patient care, the mix of types of physicians and patients’ demand for physician services.
The good news is that, overall, Medicare beneficiaries currently experience fewer problems of access than the near elderly covered by private insurance. In 2001, 11 percent of Medicare beneficiaries said they delayed or did not receive needed care compared with 18 percent of the privately insured who are 50-64 years of age. We have, however, recently seen slight declines in access to care for both groups.
Declines in access to care over time may reflect tightening of physician capacity in relation to demand. When asked the reasons for delaying or not obtaining care, respondents are increasingly reporting problems obtaining appointments. These problems are experienced by the privately insured near elderly as well as by Medicare beneficiaries. For example, in 1998-9, 16.3 percent of the Medicare beneficiaries who reported delaying or not obtaining care said they could not get an appointment soon enough compared with 20.9 percent of the privately-insured near elderly. By 2001, this had grown to 23.7 percent for Medicare beneficiaries and 25.0 percent of the privately insured near elderly (Exhibit 2).
Exhibit 1
Percent Reporting Delaying or Not Receiving Needed Care in Past Year, Comparison of Medicare Beneficiaries and Privately-Insured Near Elderly

Note: Data from the Community Tracking Study (CTS) Household Surveys, 1996-7, 1998-9 and 2000-1.
| Exhibit 2: Percent of People Who Had Problems Obtaining Care, by Reason | |||
| Reasons for Delaying/Not Obtaining Care | 1996-7 | 1998-9 | 2000-1 |
| Couldn’t get appointment soon enough | |||
| Age 50-64, privately insured | 21.9 | 20.9 | 25.0 |
| Age 65+ | 13.6 | 16.3 | 23.7 |
| Couldn’t get through on phone | |||
| Age 50-64, privately insured | 7.1 | 7.5 | 9.0 |
| Age 65+ | 7.3 | 5.4 | 11.2 |
| Couldn’t be at office when open | |||
| Age 50-64, privately insured | 15.0 | 13.5 | 16.6 |
| Age 65+ | 13.0 | 15.1 | 15.6 |
Note: Data from the Community Tracking Study (CTS) Household Surveys, 1996-7, 1998-9 and 2000-1.
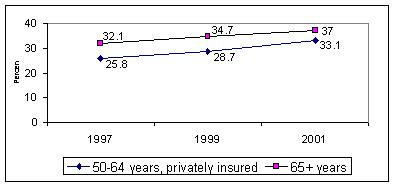
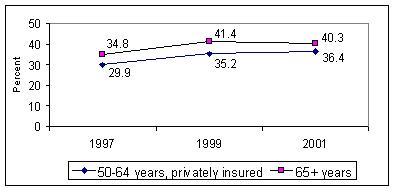
A second indication of tightening capacity is that both the elderly and near elderly are facing longer waits for appointments with their physicians. Over a third of people aged 50 and older must wait more than three weeks for a checkup, while roughly 40 percent must wait for more than a week for an appointment for a specific illness. These increases in waiting times are occurring across all age groups.
Exhibit 3
Percent Reporting Long Waits for Medical Check-ups, Comparison of Medicare Beneficiaries and Privately-Insured Near Elderly
Note: Data from the Community Tracking Study (CTS) Household Surveys, 1996-7, 1998-9 and 2000-1.
Exhibit 4
Percent Reporting Long Waits for Doctor Appointments When Ill, Comparison of Medicare Beneficiaries and Privately-Insured Near Elderly
Note: Data from the Community Tracking Study (CTS) Household Surveys, 1996-7, 1998-9 and 2000-1.
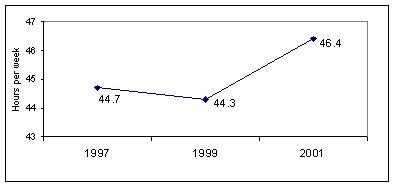
A third indication of tightening physician capacity is the increase in time that physicians are spending in patient care. Average hours per week increased sharply over the last two years. This may reflect a sharper increase in demand for services due in part the loosening restrictions in managed care. The increase in hours spent in patient care is also consistent with anecdotal reports that physicians are working harder to make up for lower fees—either meeting higher demand or creating it.
Exhibit 5
Average Hours Per Week Physicians Spend in Patient Care
Note: Data from the Community Tracking Study (CTS) Physician Surveys, 1996-7, 1998-9 and 2000-1, unweighted.
While there is considerable debate about the extent of a physician supply shortage, we do know that physicians have begun to exert increasing leverage with health plans to obtain higher payment rates.2 As managed care plans have broadened their provider networks in response to demands for more choice and physicians are less eager to be included in all networks, physician leverage with managed care plans has increased. Physicians in some specialties have won substantial increases in payment rates.3 If Medicare payment rates are falling, differentials between what physicians receive from Medicare and what they receive from private insurers would grow, putting beneficiaries’ access to care at risk.
Physicians’ Acceptance of New Medicare Patients
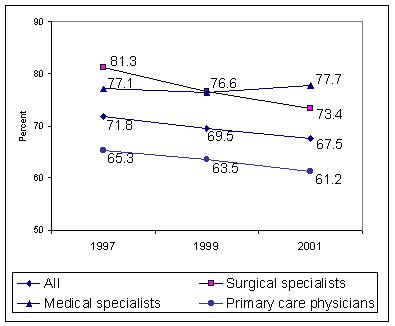
A key indicator of Medicare beneficiaries’ access to care is the proportion of physicians who are accepting new Medicare patients into their practices. As part of our longitudinal physician survey, we ask physicians whether they are accepting new Medicare patients. Over the past 4 years, there has been a 4 percentage point drop in physicians’ willingness to accept all new Medicare patients from 72 percent to 68 percent (Exhibit 6). The sharpest decline occurred for surgical specialists, while there was a modest increase for medical specialists. (For this analysis, pediatricians and physicians not accepting new privately insured patients are excluded.)
Exhibit 6
Percent of Physicians Accepting ALL New Medicare Patients, by Specialty
Note: Data from the Community Tracking Study (CTS) Physician Surveys, 1996-7, 1998-9 and 2000-1, unweighted.
The decline in accepting all new Medicare patients was the sharpest for physicians with the weakest connections to Medicare. That is, for physicians where Medicare revenues represent less than 10 percent of their practice revenue, acceptance of all new Medicare patients fell from 59 percent to 46 percent (Exhibit 7). In contrast, for physicians where Medicare revenues are over a half of their practice revenue, acceptance of new Medicare patients fell from 77 percent to 72 percent.
| Exhibit 7: Percent of Physicians Accepting ALL New Medicare Patients by Medicare Revenue | |||
| Medicare revenue as percent of practice revenue | 1996-7 | 1998-9 | 2000-1 |
| Medicare revenue under 10 percent | 59.1 | 55.8 | 45.9 |
| Medicare revenue of 11 to 29 percent | 71.4 | 69.1 | 64.8 |
| Medicare revenue of 30 to 49 percent | 75.3 | 74.1 | 71.5 |
| Medicare revenue of 50 or more percent | 76.6 | 73.2 | 71.9 |
Note: Data from the Community Tracking Study (CTS) Physician Surveys, 1996-7, 1998-9 and 2000-1, unweighted.
Similarly, physicians with the lowest revenue from Medicare were the most likely to report accepting no new Medicare patients. Among physicians who get less than 10 percent of their practice revenue from Medicare the number who now refuse to accept Medicare patients climbed from 12 percent to 21 percent in four years (Exhibit 8). In comparison, negligible changes occurred for physicians with higher Medicare revenues as a percent of their total practice revenue.
| Exhibit 8: Percent of Physicians Accepting NO New Medicare Patients by Medicare Revenue | |||
| Medicare revenue as percent of practice revenue | 1996-7 | 1998-9 | 2000-1 |
| Medicare revenue under 10 percent | 11.9 | 14.1 | 21.1 |
| Medicare revenue of 11 to 29 percent | 2.8 | 2.7 | 3.4 |
| Medicare revenue of 30 to 49 percent | 1.7 | 1.6 | 1.2 |
| Medicare revenue of 50 or more percent | 0.0 | 0.0 | 0.0 |
Note: Data from the Community Tracking Study (CTS) Physician Surveys, 1996-7, 1998-9 and 2000-1, unweighted.
Medicare Physician Payments Relative to Private Payers
The extent to which Medicare patients’ access to care is compromised by Medicare physician payment cuts will depend on the community where beneficiaries live. This is because the relationship between Medicare payment rates and the rates paid by private insurers vary widely across communities. As part of our site visits to 12 communities, we conduct interviews with health plans and physician groups. From those interviews, we have found an extensive use of the Medicare relative value scale by private health plans and have also found that Medicare payment methods have had a large influence on the private sector. In fact, many health plans explicitly set their payments as a percentage of what Medicare pays.
There is considerable geographic variation in relative payments across the 12 communities we track. In Miami, Northern New Jersey and Orange County, California, private insurers’ physician payment rates relative to Medicare are relatively low compared with other communities. For example, in Miami, private payments range from 80 to 108 percent of Medicare physician payments. In Northern New Jersey, private rates ranged from 95 to 105 percent of Medicare payments. In contrast, Boston, Cleveland, Greenville, Little Rock and Seattle have private rates that are much higher than Medicare. For example, private payments in Little Rock range from 120 to 180 percent of Medicare physician payments and from 100 to 150 percent in Boston.
This pattern of relative differences across markets has remained stable over time. Those markets that are typically more generous than Medicare have maintained these higher rates over the last 6 years of our study. Similarly, the communities with the lowest rates have consistently paid lower rates than other communities.
As a result of this variation in communities, a substantial decline in Medicare payments would pose the greatest risk to beneficiaries’ access in those communities, such as Boston and Little Rock, where Medicare payment rates are the lowest relative to private rates. With the potential of "hot spots" of poor access developing in certain communities, new approaches for monitoring access in Medicare may be needed.
Implications
Since the Medicare program’s inception in 1966, access to care for the elderly has not been a significant issue. This included the transition to the Medicare Fee Schedule that began in 1992.4 But our research raises concerns about access in the near future. Physician capacity to meet the demands of patients appears to be tightening and could tighten even further in the future. At the same time, payment rates in private insurance have been increasing, particularly for specialists.
Current policy established Medicare physician payment rates within the constraints of the federal budget. It also linked updates to the rate of growth of program spending and the growth of the economy. But attention also needs to be paid to Medicare beneficiaries’ ability to command services in an environment of tightening capacity. MedPAC’s recommendation of pegging updates in payment rates to trends in input prices would avoid cuts in the short term. However, given trends in the private markets, even under the MedPAC recommendation we would expect to see a widening gap between Medicare and private payment rates over the next few years. For this reason, just fixing the formula may not be enough to protect access to care for Medicare beneficiaries. At a minimum, more explicit attention to trends in Medicare beneficiaries’ access nationally and within communities is advisable.