
Mounting Pressures: Physicians Serving Medicaid Patients and the Uninsured, 1997-2001
Tracking Report No. 6
December 2002
Peter J. Cunningham
![]() he proportion of doctors providing any charity care decreased from 76.3 percent in 1997 to 71.5 percent in 2001, according to a new study by the Center for Studying Health System
Change (HSC). The proportion of physicians serving Medicaid patients also decreased from 87.1 percent in 1997 to 85.4 percent in 2001. The small decrease in physicians serving
Medicaid patients does not appear to have had any negative effects on access to physicians among Medicaid beneficiaries. On the other hand, the more sizable decrease in physicians
providing charity care is consistent with other evidence showing decreased access to physicians by uninsured persons. New budget pressures could lead states to freeze or cut Medicaid provider payment rates, which could then trigger access problems.
he proportion of doctors providing any charity care decreased from 76.3 percent in 1997 to 71.5 percent in 2001, according to a new study by the Center for Studying Health System
Change (HSC). The proportion of physicians serving Medicaid patients also decreased from 87.1 percent in 1997 to 85.4 percent in 2001. The small decrease in physicians serving
Medicaid patients does not appear to have had any negative effects on access to physicians among Medicaid beneficiaries. On the other hand, the more sizable decrease in physicians
providing charity care is consistent with other evidence showing decreased access to physicians by uninsured persons. New budget pressures could lead states to freeze or cut Medicaid provider payment rates, which could then trigger access problems.
- Most Physicians Still Involved
- Low Volume of Medicaid and Uninsured Patients
- Accepting New Medicaid Patients
- Closed Practices Increasing in Managed Care
- Tight Medicaid Payment Rates in Some Areas
- Effect on Access Small, So Far
- Clouds on the Horizon
- Data Source
- Notes
Most Physicians Still Involved
![]() any low-income persons—especially those enrolled in Medicaid
or who have no insurance—often have difficulty finding physicians who are willing
to accept them as patients. Low Medicaid reimbursement rates have been a consistent
barrier to participation for many physicians. Constraints on payments from managed
care and other sources are reducing physicians’ ability to cross-subsidize care
they provide to uninsured patients. Continued economic disincentives to serve
low-income patients come at a time when enrollment in Medicaid and other public
programs has been increasing, and the number of uninsured is increasing again
after modest declines in recent years.1
any low-income persons—especially those enrolled in Medicaid
or who have no insurance—often have difficulty finding physicians who are willing
to accept them as patients. Low Medicaid reimbursement rates have been a consistent
barrier to participation for many physicians. Constraints on payments from managed
care and other sources are reducing physicians’ ability to cross-subsidize care
they provide to uninsured patients. Continued economic disincentives to serve
low-income patients come at a time when enrollment in Medicaid and other public
programs has been increasing, and the number of uninsured is increasing again
after modest declines in recent years.1
Although the majority of physicians care for Medicaid and uninsured patients who are unable to pay, the percentage of physicians serving these patients has declined. The proportion of physicians deriving income from Medicaid dropped slightly, from 87.1 percent in 1997 to 85.4 percent in 2001 (see Figure 1). The proportion of physicians providing charity care dropped more substantially, from 76.3 percent in 1997 to 71.5 percent in 2001.
Figure 1Physicians Who See Medicaid and Charity Care Practice
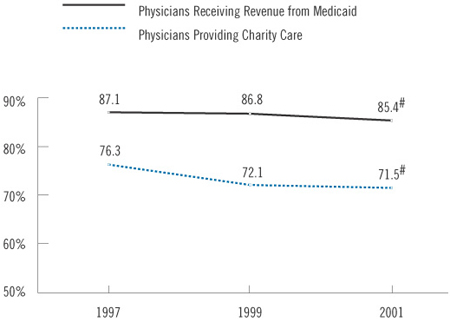
# Change from 1997 to 2001 is statistically significant at p<.05 level.
Source: HSC Community Tracking Study Physician Survey
Low Volume of Medicaid and Uninsured Patients
![]() ost physicians who serve Medicaid and charity care patients
see relatively few of these patients. Among physicians with any revenue from
Medicaid, more than half derived 10 percent or less of their total practice
revenue from Medicaid, and only about one-fourth (25.6%) derived more than 20
percent of their revenue from Medicaid. Between 1997 and 2001, however, the
percentage of low-volume Medicaid providers decreased (from 56.6% to 53.1%),
while the percentage of high-volume providers increased (from 22.2% to 25.6%).
This indicates a greater concentration of Medicaid patients in fewer practices,
and suggests no overall decrease in access to physicians among Medicaid beneficiaries
if the slightly fewer physician practices serving Medicaid are seeing a higher
volume of patients.
ost physicians who serve Medicaid and charity care patients
see relatively few of these patients. Among physicians with any revenue from
Medicaid, more than half derived 10 percent or less of their total practice
revenue from Medicaid, and only about one-fourth (25.6%) derived more than 20
percent of their revenue from Medicaid. Between 1997 and 2001, however, the
percentage of low-volume Medicaid providers decreased (from 56.6% to 53.1%),
while the percentage of high-volume providers increased (from 22.2% to 25.6%).
This indicates a greater concentration of Medicaid patients in fewer practices,
and suggests no overall decrease in access to physicians among Medicaid beneficiaries
if the slightly fewer physician practices serving Medicaid are seeing a higher
volume of patients.
Among physicians providing any charity care, 70.2 percent spend less than 5 percent of their total practice time on charity care, while 29.8 percent spend 5 percent or more of their practice time on charity care. In contrast to Medicaid, however, the proportion of high-volume charity care providers decreased between 1997 and 2001 (from 33.5% to 29.8%), while the proportion of low-volume care providers increased (from 66.5% to 70.2%). Thus, not only is the proportion of physicians who provide any charity care decreasing, but those who provide such care are spending less time doing so. As a consequence, access to physicians by uninsured persons may be decreasing to a much greater extent than for Medicaid patients.
Back to Top
Accepting New Medicaid Patients
![]() hysicians also limit the number of new Medicaid and uninsured
patients in their practice to a much greater extent than they do other patients.
In 2001, approximately one-fifth of physicians were not accepting any new Medicaid
patients, and 16 percent were not accepting any new uninsured patients (see
Table 1). This compares with less than 5 percent of doctors who were not
accepting any new Medicare or privately insured patients. About half of physicians
accepted all new Medicaid patients in 2001; less than half (44%) accepted all
new uninsured patients, compared with 71.1 percent who accepted all new Medicare
patients and 68.2 percent who accepted all new privately insured patients.
hysicians also limit the number of new Medicaid and uninsured
patients in their practice to a much greater extent than they do other patients.
In 2001, approximately one-fifth of physicians were not accepting any new Medicaid
patients, and 16 percent were not accepting any new uninsured patients (see
Table 1). This compares with less than 5 percent of doctors who were not
accepting any new Medicare or privately insured patients. About half of physicians
accepted all new Medicaid patients in 2001; less than half (44%) accepted all
new uninsured patients, compared with 71.1 percent who accepted all new Medicare
patients and 68.2 percent who accepted all new privately insured patients.
The extent to which physicians are closing their practices to new Medicaid patients is increasing, although the rise is small. The proportion of physicians accepting no new Medicaid patients rose to 20.9 percent in 2001, from 19.4 percent in 1997.2 More doctors are closing their practices to privately insured and Medicare patients, indicating that broader concerns are driving the increases in closed practices. In fact, among physicians who are accepting most or all of new privately insured patients, the proportion accepting no new Medicaid patients held steady at around 16 percent. Cost pressures from both public and private payers, capacity constraints and increasing demand by patients may be responsible for the general growth in closed practices.3
| TABLE 1: Acceptance of New Patients | |||
1997 |
1999 |
2001 |
|
| Accepting No New Patients | |||
| Medicaid | 19.4% |
19.1% |
20.9%* |
| Uninsured | NA |
NA |
16.2 |
| Medicare | 3.1 |
3.4 |
3.8 # |
| Private | 3.6 |
3.6 |
4.9* # |
| Accepting All New Patients | |||
| Medicaid | 51.1 |
52.7* |
51.9 |
| Uninsured | NA |
NA |
44.5 |
| Medicare | 74.6 |
72.5 |
71.1 # |
| Private | 70.8 |
70.5 |
68.2* # |
| NA=Not Available. Physicians were not asked
about their acceptance of new uninsured patients. 1 Excludes pediatricians * Change from previous period is statistically significant at p<.05 level. # Change from 1997 to 2001 is statistically significant at p<.05 level. Source: HSC Community Tracking Study Physician Survey |
|||
Back to Top
Closed Practices Increasing in Managed Care
![]() hysicians who are heavily involved with managed care are
increasingly closing their practices to new Medicaid patients. Among physicians
who received more than 75 percent of their practice revenue from managed care,
the proportion with practices closed to Medicaid increased to 27.3 percent in
2001, from 20.7 percent in 1997 (see Table 2). Among physicians
in group- or staff-model HMOs, the portion not accepting new Medicaid patients
increased to 21.7 percent in 2001, from 15.1 percent in 1997. In contrast, physicians
who derived less income from managed care did not change the rate at which they
accepted new Medicaid patients.
hysicians who are heavily involved with managed care are
increasingly closing their practices to new Medicaid patients. Among physicians
who received more than 75 percent of their practice revenue from managed care,
the proportion with practices closed to Medicaid increased to 27.3 percent in
2001, from 20.7 percent in 1997 (see Table 2). Among physicians
in group- or staff-model HMOs, the portion not accepting new Medicaid patients
increased to 21.7 percent in 2001, from 15.1 percent in 1997. In contrast, physicians
who derived less income from managed care did not change the rate at which they
accepted new Medicaid patients.
Physicians with heavy managed care involvement also were increasingly closing their practices to Medicare patients. Among physicians who receive 76 percent or more of their revenue from managed care, the proportion not accepting Medicare patients increased from 12.7 percent in 1997 to 15.7% in 2001. In contrast, the percentage of these doctors who were accepting no new privately insured patients did not change (about 4%).
This pattern of closing practices to Medicaid and Medicare patients while accepting privately insured patients may be related to the exit of many commercial health plans from Medicaid and Medicare managed care due to low payment rates and other market factors.4 The exit of these plans may mean that at least some provider networks affiliated with them no longer serve Medicaid or Medicare patients.
| TABLE 2: Physicians Accepting No New Medicaid Patients | |||
1997 |
1999 |
2001 |
|
| All Physicians | 19.4% |
19.1% |
20.9% # |
| Revenue from Managed Care | |||
| 1-25% | 16.6 |
14.5* |
16.2 |
| 26-50% | 16.5 |
17.4 |
17.7 |
| 51-75% | 22.1 |
20.8 |
22.2 |
| 76-100% | 20.7 |
20.9 |
27.3* # |
| 1 By level of managed care involvement. * Change from previous period is statistically significant at p<.05 level. # Change from 1997 to 2001 is statistically significant at p<.05 level. Source: HSC Community Tracking Study Physician Survey |
|||
Back to Top
Tight Medicaid Payment Rates in Some Areas
![]() arlier research has found that physicians are more likely
to accept Medicaid patients in states with relatively high reimbursement levels.5
This pattern is found in some of the 12 nationally representative communities
in which HSC conducts site visits (see Table 3). For example,
in 2001, Northern New Jersey had the highest proportion of practices closed
to Medicaid patients (38.3 percent) and one of the lowest Medicaid reimbursement
rates for office visits. By contrast, Cleveland, Boston and Little Rock had
higher Medicaid fees and a much smaller proportion of practices closed to new
Medicaid patients.6
arlier research has found that physicians are more likely
to accept Medicaid patients in states with relatively high reimbursement levels.5
This pattern is found in some of the 12 nationally representative communities
in which HSC conducts site visits (see Table 3). For example,
in 2001, Northern New Jersey had the highest proportion of practices closed
to Medicaid patients (38.3 percent) and one of the lowest Medicaid reimbursement
rates for office visits. By contrast, Cleveland, Boston and Little Rock had
higher Medicaid fees and a much smaller proportion of practices closed to new
Medicaid patients.6
Other communities do not follow this pattern. For example, Phoenix has a relatively high proportion of practices closed to Medicaid despite having some of the highest Medicaid fees. A booming population in the Phoenix area may be fueling an increase in demand for physician services and leading to severe capacity constraints among medical providers. Physicians may be responding to this in part by limiting Medicaid patients in favor of more profitable privately insured patients. Other differences across communities, such as the prevalence of Medicaid managed care (which uses a different payment scheme), administrative rules and other market factors, also may contribute to differences across communities in physicians’ willingness to take on new Medicaid patients.
Some communities also saw significant changes in the percentage of physicians accepting no new Medicaid patients between 1997 and 2001. The proportion of physicians with closed practices decreased significantly in Cleveland and increased significantly in Seattle. Recent changes in Medicaid provider payments may have been a factor in these communities. Between 1998 and 2000, Ohio increased Medicaid reimbursement for office visits by about 25 percent.7 Aggressive moves to contain health care costs in Washington state led several health plans to withdraw from Medicaid’s managed care program in Seattle because physicians refused to participate, given the low payment levels.8
| TABLE 3: Geographic Variation: Physicians Not Accepting New Medicaid Patients | |||
| |
Fee Level for
Office Visit, 2000 |
Percent Accepting No New Medicaid Patients |
|
| |
2001 |
Change from
1997 |
|
| Cleveland, Ohio | $34 |
8.0% |
-5.7% # |
| Boston, Mass. | 44 |
11.8 |
+3.3 |
| Little Rock, Ark. | 66 |
12.6 |
-0.9 |
| Lansing, Mich. | 32 |
16.4 |
-0.3 |
| Indianapolis, Ind. | 26 |
17.9 |
-2.1 |
| Greenville, S.C. | 22 |
19.3 |
+0.8 |
| Seattle, Wash. | 27 |
19.8 |
+9.2 # |
| Syracuse, N.Y. | 11 |
21.7 |
+3.1 |
| Miami, Fla. | 26 |
25.6 |
+2.2 |
| Phoenix, Ariz. | 45 |
27.5 |
+1.6 |
| Orange County, Calif. | 24 |
34.4 |
-6.6 |
| Northern New Jersey | 16 |
38.3 |
+7.8 |
| Metropolitan areas over 200,000 persons |
-- |
21.2 |
+1.8 # |
| # Change from 1997 to 2001 is statistically
significant at p<.05 level. Sources: State Medicaid Fee-for-Service Payment for a 15-Minute Office Visit for an Established Patient—Menges, Joel, et al., Comparing Physician and Dentist Fees Among Medicaid Programs, Medi-Cal Policy Institute (2001); Percent Accepting No New Medicaid Patients—HSC Community Tracking Study Physician Survey |
|||
Back to Top
Effect on Access Small, So Far
![]() he decline in physician participation in Medicaid is
small at this point, and there is little evidence of a
decrease in access to physicians among Medicaid beneficiaries.
While there was a slight decrease in the proportion
of Medicaid enrollees with a usual source of care
(from 92.9% in 1997 to 90.6% in 2001), this mirrored an
overall decrease in the United States. Actual use of physician
services by individuals enrolled in Medicaid did not
change during this period either.
he decline in physician participation in Medicaid is
small at this point, and there is little evidence of a
decrease in access to physicians among Medicaid beneficiaries.
While there was a slight decrease in the proportion
of Medicaid enrollees with a usual source of care
(from 92.9% in 1997 to 90.6% in 2001), this mirrored an
overall decrease in the United States. Actual use of physician
services by individuals enrolled in Medicaid did not
change during this period either.
The larger decreases in physician charity care are consistent with evidence of a decline in access to physicians among uninsured persons. The percentage of uninsured persons with a usual source of care—which is already far lower than for any insured group—dropped to 64.2 percent in 2001, down from 68.6 percent in 1997, and the proportion of uninsured persons seeing a physician dropped to 46.6 percent in 2001, from 51.5 percent in 1997. Among those with any visits, the average number of visits did not change.
Back to Top
Clouds on the Horizon
![]() ontinued financial pressures on physicians may decrease
their willingness to serve Medicaid patients even further, potentially endangering
access to care. States are experiencing serious budget pressures, and most are
considering reducing or freezing Medicaid physician reimbursement to cut program
costs.9 Rising health care costs as well as reductions
in other provider payments may constrain physicians’ ability further to cross-subsidize
free care to uninsured patients. And access to physicians is just one concern,
as more general cost-containment measures being considered or implemented by
states also could affect access to hospitals and prescription drugs among both
Medicaid and uninsured patients. Continued monitoring of physicians’ involvement
with Medicaid and charity care will be essential to assessing access to care
for the uninsured and those enrolled in Medicaid.
ontinued financial pressures on physicians may decrease
their willingness to serve Medicaid patients even further, potentially endangering
access to care. States are experiencing serious budget pressures, and most are
considering reducing or freezing Medicaid physician reimbursement to cut program
costs.9 Rising health care costs as well as reductions
in other provider payments may constrain physicians’ ability further to cross-subsidize
free care to uninsured patients. And access to physicians is just one concern,
as more general cost-containment measures being considered or implemented by
states also could affect access to hospitals and prescription drugs among both
Medicaid and uninsured patients. Continued monitoring of physicians’ involvement
with Medicaid and charity care will be essential to assessing access to care
for the uninsured and those enrolled in Medicaid.
Back to Top
Data Source
![]() his Tracking Report presents findings from the HSC Community
Tracking Study Physician and Household Surveys conducted in 1996-97, 1998-99
and 2000-01. They are both nationally representative telephone surveys. Each
of the surveys was conducted over a 12-month period that overlapped two calendar
years (i.e., from September 2000 to September 2001). For discussion and presentation,
we refer to single calendar years of the survey (1997, 1999 and 2001).
his Tracking Report presents findings from the HSC Community
Tracking Study Physician and Household Surveys conducted in 1996-97, 1998-99
and 2000-01. They are both nationally representative telephone surveys. Each
of the surveys was conducted over a 12-month period that overlapped two calendar
years (i.e., from September 2000 to September 2001). For discussion and presentation,
we refer to single calendar years of the survey (1997, 1999 and 2001).
The Physician Survey is of nonfederal, patient care physicians who spend at least 20 hours a week in direct patient care. Each round of the survey contains information on about 12,500 physicians, and the response rates ranged from 59 percent to 65 percent.
The Household Survey is of the civilian, noninstitutionalized population. Data were supplemented by in-person interviews of households without telephones to ensure proper representation. Each round of the survey contains information on about 60,000 people, and the response rates ranged from 59 percent to 65 percent.
More detailed information on survey methodology can be found at www.hschange.org.
Back to Top
Notes
Back to Top
TRACKING REPORTS are published by the Center for Studying Health System Change.
President: Paul B. Ginsburg
Director of Public Affairs: Richard Sorian
Editor: The Stein Group
Contact HSC at:
600 Maryland Avenue, SW Suite 550
Washington, DC 20024-2512
Tel: (202) 554-7549 (for publication information)
Tel: (202) 484-5261 (for general HSC information)
Fax: (202) 484-9258
www.hschange.org