Tracking Health Care Costs: Trends Slow in First Half of 2003 Data Bulletin No. 26 |
||
Tracking Health Care Costs
Trends Stabilize but Remain High in 2002
Data Bulletin No. 25
June 2003
![]() ealth care spending per privately insured American jumped
9.6 percent in 2002, growing nearly four times faster than the overall economy
(see Table 1).
ealth care spending per privately insured American jumped
9.6 percent in 2002, growing nearly four times faster than the overall economy
(see Table 1).
While still extremely high, health care spending growth slowed for the first time in five years, down slightly from 10 percent in 2001. Slowing trends in all four categories of 2002 spending—inpatient and outpatient hospital care, prescription drugs and physician services—signal a waning of some of the forces driving ever-larger increases since 1997.
Nonetheless, private health insurance premium trends accelerated again in 2003—increasing an average 15 percent, the largest jump in at least a decade—and continued to outpace underlying health care spending. Premium increases would have been even higher in 2003—an estimated average 18 percent—if not for greater patient cost sharing.
| TABLE 1: Annual Change Per Capita in Health Care Spending and Gross Domestic Product, 1991-2002 | ||||||
Spending on Type of Health Care Service |
||||||
Year |
All Services |
Hospital Inpatient |
Hospital Outpatient |
Physician |
Prescription Drugs |
Gross Domestic Product (GDP) |
| 1991 | 6.9% |
3.5% |
16.8% |
5.4% |
12.4% |
1.8% |
| 1992 | 6.6 |
2.8 |
13.9 |
5.9 |
11.7 |
4.2 |
| 1993 | 5.0 |
4.8 |
8.9 |
3.3 |
7.1 |
3.8 |
| 1994 | 2.1 |
-2.0 |
8.7 |
1.7 |
5.2 |
4.9 |
| 1995 | 2.2 |
-3.5 |
7.9 |
1.9 |
10.6 |
3.7 |
| 1996 | 2.0 |
-4.4 |
7.7 |
1.6 |
11.0 |
4.4 |
| 1997 | 3.3 |
-5.3 |
9.5 |
3.4 |
11.5 |
5.2 |
| 1998 | 5.3 |
-0.2 |
7.5 |
4.7 |
14.1 |
4.3 |
| 1999 | 7.1 |
1.6 |
10.2 |
5.0 |
18.4 |
4.4 |
| 2000 | 7.8 |
2.5 |
11.5 |
6.3 |
14.5 |
4.8 |
| 2001 | 10.0 |
7.1 |
16.3 |
6.7 |
13.8 |
1.7 |
| 2002 | 9.6 |
6.8 |
14.6 |
6.5 |
13.2 |
2.7 |
|
Notes: GDP is in nominal dollars. Sources: Health care spending data are the Milliman USA Health Cost Index ($0 deductible); GDP is from the U.S. Department of Commerce, Bureau of Economic Analysis |
||||||
Hospital Price Inflation
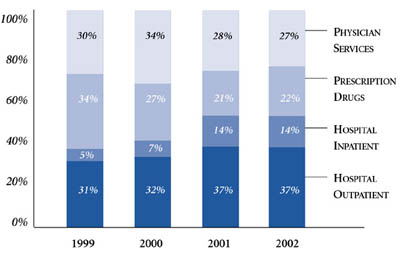
![]() apid growth in hospital spending per privately insured
person—increasingly driven by price inflation rather than increased use
of services—accounted for more than half of the overall spending increase
(51%) for the second straight year (see Figure 1). Spending
on inpatient hospital care increased 6.8 percent in 2002, accounting for 14
percent of total spending growth. Spending on outpatient hospital care grew
14.6 percent in 2002—again surpassing prescription drugs as the fastest
growing spending component—and accounted for 37 percent of overall spending
growth.
apid growth in hospital spending per privately insured
person—increasingly driven by price inflation rather than increased use
of services—accounted for more than half of the overall spending increase
(51%) for the second straight year (see Figure 1). Spending
on inpatient hospital care increased 6.8 percent in 2002, accounting for 14
percent of total spending growth. Spending on outpatient hospital care grew
14.6 percent in 2002—again surpassing prescription drugs as the fastest
growing spending component—and accounted for 37 percent of overall spending
growth.
After climbing 8 percent in 2001, the hospital utilization trend slowed to 5.7 percent in 2002. This slowdown is likely a result of increased patient cost sharing, which leads to less demand for services, and the completion of the transition to more loosely managed care.
Hospital prices increased 5.1 percent in 2002, the largest one-year jump since at least 1994. As a result of higher prices and the slowing trend of increased utilization, price inflation accounted for almost half of the increase in hospital spending in 2002 compared with about a third in 2001.
Recent evidence from Center for Studying Health System Change (HSC) site visits suggests hospitals continue to use their formidable negotiating leverage to demand large payment rate increases from health plans—in part to reverse the effect of discounted hospital payment rates in the mid-1990s.
Hospitals also may be seeking to pass through higher wage increases granted in response to labor shortages, particularly for nurses. Because hospitals negotiate health plan payment contracts prospectively, unexpected growth in wage rates in one year affects payment rates negotiated in subsequent years. The large 2002 hospital price increase may reflect the extremely sharp 6.1 percent wage rate increase in 2001. Hospital wage rates also grew rapidly—5.5 percent—in 2002.
For the third year in a row, prescription drug spending increased at a slower pace, growing 13.2 percent in 2002 and accounting for 22 percent of overall spending growth. Several factors help explain the slowdown, including increased use of three-tier copayment structures, a reduction in new drugs and greater availability of generic drugs.
Spending on physician services increased 6.5 percent in 2002, accounting for 27 percent of the total spending increase. Both higher prices and increased use of physician services played a role, but growing utilization was the more important factor.
Figure 1
Shares of Overall Health Care Spending Growth,
1999-2002
Sources: Milliman USA Health Cost Index ($0 deductible)
Outlook
![]() he 2002 cost trend story was decidedly mixed: A long period
of accelerating growth in health care costs underlying private health insurance
premiums finally ended, but the cost trend remained extremely high. Moreover,
the cost trend outlook is equally mixed. Forces, such as more patient cost sharing,
could slow spending growth, but countervailing forces, such as the continued
provider buildup of capacity—especially for highly paid specialty services—could
accelerate the cost trend.
he 2002 cost trend story was decidedly mixed: A long period
of accelerating growth in health care costs underlying private health insurance
premiums finally ended, but the cost trend remained extremely high. Moreover,
the cost trend outlook is equally mixed. Forces, such as more patient cost sharing,
could slow spending growth, but countervailing forces, such as the continued
provider buildup of capacity—especially for highly paid specialty services—could
accelerate the cost trend.
Despite the uncertainty about future cost trends, conditions do seem ripe for a modest slowing of premium trends, driven by a turn in the underwriting cycle—the insurance industry’s interdependent pattern of profitability and pricing.Most major insurers are strongly profitable, which will eventually trigger a new round of price competition as plans shift their focus to growing market share. Nevertheless, until cost trends slow significantly, premiums will continue to grow rapidly and the number of uninsured will likely continue to rise.
This Data Bulletin is based on data from the Milliman USA Health Cost Index ($0 deductible),which is designed to reflect claims trends faced by private insurers; the U.S. Bureau of Labor Statistics’ Employment,Hours and Earnings series to track payroll costs and Producer Price Index for general medical and surgical hospitals and for offices of physicians to track hospital and physician prices; and the Towers Perrin 2003 Health Care Cost Survey and the eighth annual Washington Business Group on Health and Watson Wyatt Worldwide Employer Survey of Trends in the Health Care Marketplace. It is adapted from "Tracking Health Care Costs: Trends Stabilize but Remain High in 2002" by Bradley C. Strunk and Paul B. Ginsburg, Health Affairs,Web-exclusive publication, June 11, 2003,www.healthaffairs.org.
Data Bulletins are published by the Center for Studying Health System Change
(HSC)
President: Paul B. Ginsburg
Director of Public Affairs: Richard Sorian
Editor: The Stein Group