
Tracking Health Care Costs: Spending Growth Remains Stable at High Rate in 2005
Data Bulletin No. 33
October 2006
Paul B. Ginsburg, Bradley C. Strunk, Michelle I. Banker, John P. Cookson
![]() Health care spending per privately insured American increased
7.4 percent in 2005, marking the third year that the cost trend hovered below
8 percent, following a peak increase of 10.4 percent in 2001. Spending data
for the first quarter of 2006 suggest continued stability—albeit at a relatively
high rate of growth (7.7%). In 2005, health spending growth continued to outpace
overall economic growth, despite a robust 5.4 percent increase in the overall
U.S. economy as measured by per capita gross domestic product (see Table
1).
Health care spending per privately insured American increased
7.4 percent in 2005, marking the third year that the cost trend hovered below
8 percent, following a peak increase of 10.4 percent in 2001. Spending data
for the first quarter of 2006 suggest continued stability—albeit at a relatively
high rate of growth (7.7%). In 2005, health spending growth continued to outpace
overall economic growth, despite a robust 5.4 percent increase in the overall
U.S. economy as measured by per capita gross domestic product (see Table
1).
Trends in three of the five spending categories—inpatient hospital care, physician services, and other services—accelerated in 2005, while prescription drug spending grew at a slower rate for the sixth year in a row and hospital outpatient care spending growth slowed slightly.
Despite the stability in spending growth, the slowdown in employer-sponsored health insurance premium growth continued in 2006 as average premiums increased 7.7 percent, compared with 9.2 percent in 2005, according to the Kaiser Family Foundation/Health Research and Educational Trust 2006 Survey of Employer Health Benefits. The continued slowdown in premium trend likely reflects the lagged relationship between underlying cost trends and premium trends. In recent years employers have increased patient cost sharing, through higher deductibles, copayments and coinsurance, as a way to cope with high premium increases. Increasing cost sharing appears to have continued in 2006 for the fifth year in a row. Without this so-called benefit buy down, or change in benefit structure, the premium trend would have been higher in recent years
Over time, premium increases cannot be lower than underlying cost trends without continued benefit shrinkage. So major relief from the financial burden of rapidly rising premiums does not appear to be on the horizon, and the premium trend is unlikely to continue to decline in the coming years.
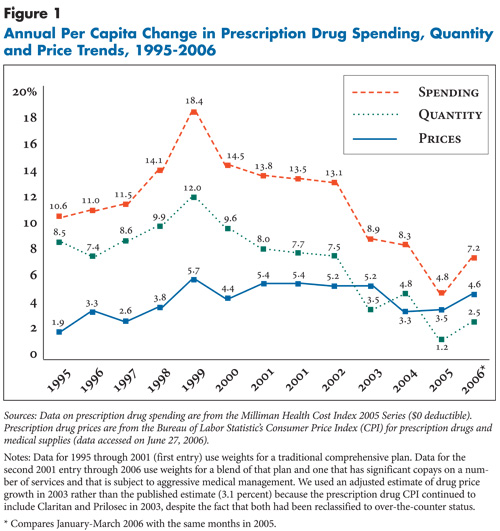
Prescription drugs. For the sixth year in a row, prescription drug spending per privately insured person increased at a slower pace, growing 4.8 percent in 2005—compared with 8.3 percent in 2004 and almost less than a quarter of the 1999 peak increase of 18.4 percent. The slowdown in 2005 was largely a result of slower growth in drug utilization rather than changes in the growth of drug prices (see Figure 1). The sharp slowdown in drug spending is showing signs of reversing as early 2006 data peg the increase at 7.2 percent.
Hospital spending. Spending on inpatient services increased 7.1 percent in 2005, up from the 5.3 percent increase in 2004. Spending on outpatient care increased 10.4 percent, down slightly from 11.2 percent in 2004. The outpatient hospital category includes spending for services provided in freestanding facilities, such as surgery centers and imaging centers. After slowing sharply in previous years, the hospital utilization trend—for inpatient and outpatient care combined—increased 4.5 percent in 2005, up sharply from 1.3 percent in 2004, while hospital price growth slowed sharply to 4.3 percent in 2005, down from 7.1 percent in 2004.
Physician care and other services. Spending on physician care increased 7.1 percent in 2005, up from 6.0 percent in 2004, primarily reflecting growth in the use of physician services. Spending on other types of services, most notably home health care and ambulance services, grew 12 percent in 2005.
Table 1
|
|||||||
|
Change in Spending on Type of Health Care Service
|
|||||||
| Year |
All Services
|
Hospital Inpatient
|
Hospital Outpatient
|
Physician
|
Rx Drugs
|
Other
|
GDP
|
| 1995 |
2.2%
|
-3.5%
|
7.9%
|
1.9%
|
10.6%
|
n/a
|
3.4%
|
| 1996 |
2.0
|
-4.4
|
7.7
|
1.6
|
11.0
|
n/a
|
4.4
|
| 1997 |
3.3
|
-5.3
|
9.5
|
3.4
|
11.5
|
n/a
|
5.0
|
| 1998 |
5.3
|
-0.2
|
7.5
|
4.7
|
14.1
|
n/a
|
4.1
|
| 1999 |
7.1
|
1.6
|
10.2
|
5.0
|
18.4
|
n/a
|
4.8
|
| 2000 |
7.8
|
4.1
|
9.8
|
6.3
|
14.5
|
n/a
|
4.8
|
| 2001 |
10.0
|
8.7
|
14.6
|
6.7
|
13.8
|
n/a
|
2.1
|
| 2001 |
10.4
|
8.5
|
14.6
|
7.7
|
13.5
|
8.5%
|
2.1
|
| 2002 |
10.1
|
8.2
|
13.0
|
7.9
|
13.1
|
6.9
|
2.3
|
| 2003 |
7.8
|
6.1
|
11.1
|
6.3
|
8.9
|
4.1
|
3.7
|
| 2004 |
7.5
|
5.3
|
11.2
|
6.0
|
8.3
|
6.3
|
5.8
|
| 2005 |
7.4
|
7.1
|
10.4
|
7.1
|
4.8
|
12.0
|
5.4
|
| 2006 |
7.7
|
5.1
|
10.3
|
7.7
|
7.2
|
10.8
|
5.9
|
| Sources: Health care spending data are
from the Milliman Health Cost Index 2005 Series ($0 deductible). Gross Domestic
Product (GDP) is from the U.S. Department of Commerce, Bureau of Economic
Analysis. Notes: GDP is in nominal dollars. Estimates may differ from past reports because of data revisions by Milliman and the Bureau of Economic Analysis. Data for 1995 through 2001 (first entry) use weights for a traditional comprehensive plan. Data for the second 2001 entry through 2006 use weights for a blend of that plan and one that has significant copays on a number of services and that is subject to aggressive medical management. * Compares January-March 2006 with the same months in 2005. |
|||||||
Outlook
![]() ooking at potential drivers of cost trends, one can identify both drivers likely to push cost trends higher and others likely to lower cost trends. Advances in medical technology are always the “wild card,” since short-term changes in their contribution to rising costs cannot even be measured, let alone predicted. Two key factors will tend to drive cost trends higher. One is the rapid expansion of specialty facilities, including hospital inpatient and outpatient facilities, freestanding centers and additional ancillary service capability in physician offices. The combination of supply creating demand and the effects of increased physician self-referral could mean that these expansions will increase spending. The continuing growth of obesity in this country is also a major cost driver. Kenneth Thorpe and colleagues estimate that 27 percent of real per capita growth in spending from 1987 to 2001 is attributable to increasing rates of obesity and increasing relative spending by those who are obese.
ooking at potential drivers of cost trends, one can identify both drivers likely to push cost trends higher and others likely to lower cost trends. Advances in medical technology are always the “wild card,” since short-term changes in their contribution to rising costs cannot even be measured, let alone predicted. Two key factors will tend to drive cost trends higher. One is the rapid expansion of specialty facilities, including hospital inpatient and outpatient facilities, freestanding centers and additional ancillary service capability in physician offices. The combination of supply creating demand and the effects of increased physician self-referral could mean that these expansions will increase spending. The continuing growth of obesity in this country is also a major cost driver. Kenneth Thorpe and colleagues estimate that 27 percent of real per capita growth in spending from 1987 to 2001 is attributable to increasing rates of obesity and increasing relative spending by those who are obese.
Two factors stand out as having potential to lower spending trends. First, in the pharmaceutical sector, a number of important blockbuster drugs have either recently lost patent protection (Zocor) or are scheduled to lose patent protection in the near future (Zoloft). Second, the trend toward increased patient cost sharing has accelerated. To the degree that patient financial incentives are developed to encourage use of lower-cost providers or treatment alternatives, the impact of increased cost sharing could be larger than standard assumptions about health care spending’s sensitivity to patient financial incentives would suggest.
When listening to discussions in policy circles about the potential for a slowing of health care cost trends, one does not hear much about the factors outlined above. Instead, political leaders extol the potential for health information technology to save money by increasing quality of care and curbing duplication of diagnostic procedures, the potential of medical liability reform to reduce defensive medicine, the potential of quality improvements motivated by pay for performance to reduce costs and the potential for increased price transparency to lower health services’ prices substantially.
All or some of these scenarios may come to pass, but the most likely outcome over the next few years is costs continuing to outpace incomes and private health insurance becoming increasingly unaffordable for more people.
Back to Top
Data Source
This Data Bulletin is based on data from the Milliman Health Cost Index 2005 Series ($0 deductible), which is designed to reflect claims trends faced by private insurers; the U.S. Bureau of Labor Statistics’ (BLS) Producer Price Index for general medical and surgical hospitals and for physicians’ offices to track hospital and physician prices; the BLS’s Consumer Price Index for prescription drugs and medical supplies to track prescription drug prices; and the Kaiser Family Foundation/Health Research and Educational Trust 2006 Survey of Employer Health Benefits. It is adapted from “Tracking Health Care Costs: Continued Stability But At High Rates In 2005,” by Paul B. Ginsburg, Bradley C. Strunk and Michelle I. Banker of HSC; and John P. Cookson of Milliman, Health Affairs, Web-exclusive publication, Oct. 3, 2006, www.healthaffairs.org.