Financial and Health Burdens of Chronic Conditions Grow
Tracking Report No. 24
April 2009
Ha T. Tu, Genna R. Cohen
Almost 72 million working-age Americans—18-64 years old—live with chronic conditions, such as diabetes, asthma or depression. In 2007, almost three in 10, or more than 20 million people with chronic conditions, lived in families with problems paying medical bills—a significant increase from 21 percent in 2003, according to a new national study by the Center for Studying Health System Change (HSC). While problems paying medical bills are especially acute and still rising for uninsured people with chronic conditions (62%), medical-bill problems also are significant and growing among people with private insurance and higher incomes. For the more than 20 million chronically ill adults with medical bill problems in 2007, one in four went without needed medical care, half put off care and more than half went without a prescription medication because of cost concerns.
- Rising Rates of Chronic Conditions and Obesity
- Declining Private Coverage
- Medical Bill Problems on the Rise
- Uninsured Particularly Vulnerable, but Insured Face Bill Problems, Too
- Medical Debt Linked to Access Problems
- Implications
- Notes
- Supplementary Tables
- Data Source and Funding Acknowledgements
Rising Rates of Chronic Conditions and Obesity
![]() n 2007, 39 percent of the working-age population, or 72
million people, had at least one chronic health condition, such as diabetes,
asthma or depression—a significant increase from 35 percent in 2003 and
34 percent in 2001, according to HSC’s 2007 Health Tracking Household Survey
(see Data Source). Other research confirms that more and
more Americans are living with chronic conditions.1
n 2007, 39 percent of the working-age population, or 72
million people, had at least one chronic health condition, such as diabetes,
asthma or depression—a significant increase from 35 percent in 2003 and
34 percent in 2001, according to HSC’s 2007 Health Tracking Household Survey
(see Data Source). Other research confirms that more and
more Americans are living with chronic conditions.1
The increasing prevalence of chronic conditions is closely linked to rising obesity rates in the U.S. population, especially for diabetes, hypertension and heart disease. Between 2003 and 2007, the proportion of working-age Americans classified as obese—those with a body mass index of 30 or higher—grew from 25 percent to 29 percent (findings not shown). Chronic conditions are much more likely to develop among obese people. In 2007, 55 percent of obese working-age people reported having at least one chronic condition, compared with 30 percent for the normal-weight and 36 percent for the overweight working-age populations.
Declining Private Coverage
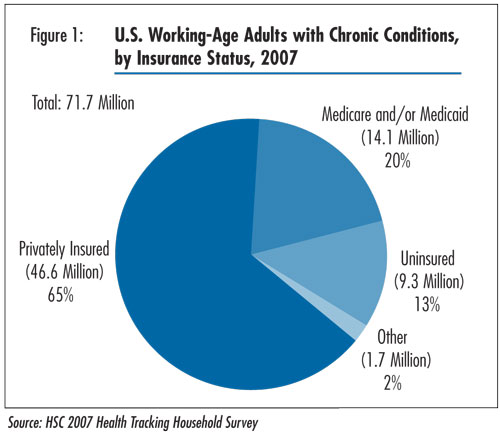
![]() he proportion of working-age people with chronic conditions
with private insurance has declined steadily this decade. In 2007, 65 percent
were privately insured (see Figure 1)—down from 68 percent
in 2003 and 71 percent in 2001 (data not shown). About one-fifth of working-age
people with chronic conditions had public insurance, primarily Medicaid and
Medicare, in 2007, an increase from 17 percent in 2003 and 16 percent in 2001.
he proportion of working-age people with chronic conditions
with private insurance has declined steadily this decade. In 2007, 65 percent
were privately insured (see Figure 1)—down from 68 percent
in 2003 and 71 percent in 2001 (data not shown). About one-fifth of working-age
people with chronic conditions had public insurance, primarily Medicaid and
Medicare, in 2007, an increase from 17 percent in 2003 and 16 percent in 2001.
The increase in public coverage helped to compensate for much of the decline in private insurance, resulting in relatively stable levels of uninsurance among working-age people with chronic conditions between 2001 and 2007—13 percent of working-age people with chronic conditions were uninsured in 2007.
Back to Top

Click here to view this figure as a PowerPoint slide.
Medical Bill Problems on the Rise
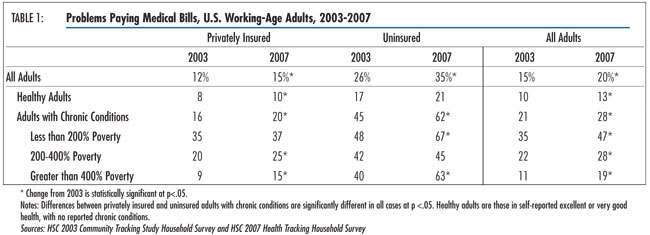
![]() n 2007, 28 percent of working-age adults with chronic conditions—more
than 20 million people—reported that their families had problems paying
medical bills in the past year—a significant increase from 21 percent in
2003 (see Table 1).
n 2007, 28 percent of working-age adults with chronic conditions—more
than 20 million people—reported that their families had problems paying
medical bills in the past year—a significant increase from 21 percent in
2003 (see Table 1).
Between 2003 and 2007, the prevalence of medical bill problems increased substantially for Americans across all income and health status categories. However, the burden of medical debt is disproportionately borne by those with health problems. Adults with chronic conditions were more than twice as likely as healthy adults to be in families with medical bill problems (28% vs. 13% in 2007).2
Among low-income people—those with incomes less than 200 percent of poverty, or $41,300 for a family of four in 2007—the incidence of medical bill problems is high. Nearly half (47%) of low-income working-age adults with chronic conditions reported problems paying medical bills in 2007—a sizeable increase from 35 percent in 2003.
Back to Top

Click here to view this figure as a PowerPoint slide.
Uninsured Particularly Vulnerable, But Insured Face Bill Problems, Too
![]() ninsured, working-age people with chronic conditions are especially vulnerable to medical bill problems: 62 percent, or 5.7 million people, are in families with such problems—a sharp increase from 45 percent in 2003. However, even people covered by private insurance are not immune to these financial concerns: one in five privately insured people with chronic conditions (9.4 million people) live in families with medical bill problems—an increase from 16 percent in 2003. Among those who are privately insured and low income, 37 percent—more than 2 million people—reported family medical bill problems, underscoring the limitations of private insurance alone in protecting people from the high costs of treating chronic conditions.
ninsured, working-age people with chronic conditions are especially vulnerable to medical bill problems: 62 percent, or 5.7 million people, are in families with such problems—a sharp increase from 45 percent in 2003. However, even people covered by private insurance are not immune to these financial concerns: one in five privately insured people with chronic conditions (9.4 million people) live in families with medical bill problems—an increase from 16 percent in 2003. Among those who are privately insured and low income, 37 percent—more than 2 million people—reported family medical bill problems, underscoring the limitations of private insurance alone in protecting people from the high costs of treating chronic conditions.
The prevalence of medical debt generally rises as out-of-pocket spending on medical care increases. However, between 2003 and 2007, when the prevalence of medical debt rose substantially, there was no corresponding increase in the proportion of people whose families had out-of-pocket medical spending exceeding certain thresholds of family income (see Supplementary Table 1). For example, the percentage of working-age people with chronic conditions whose out-of-pocket medical spending exceeds 5 percent of family income has remained unchanged overall. Among low-income people with chronic conditions, this percentage actually declined (from 38% in 2003 to 31% in 2007). The same patterns also hold true at spending thresholds of 2.5 percent and 10 percent of family income.
Yet, medical debt has been on the rise over the same period. A key explanation to this seeming inconsistency may be that when families accumulate medical debt that they are unable to pay off over time, they begin to experience financial pressures even at lower out-of-pocket spending levels.3 This is particularly true for low-income families, which are likely to have little, if any, discretionary income and savings, and for which even modest out-of-pocket expenses may result in medical debt. Indeed, for low-income people with chronic conditions whose family out-of-pocket medical spending totaled no more than 2.5 percent of income, 36 percent reported medical bill problems in 2007—a substantial increase from 22 percent in 2003 (see Supplementary Table 2).
Back to Top
Medical Debt Linked to Access Problems
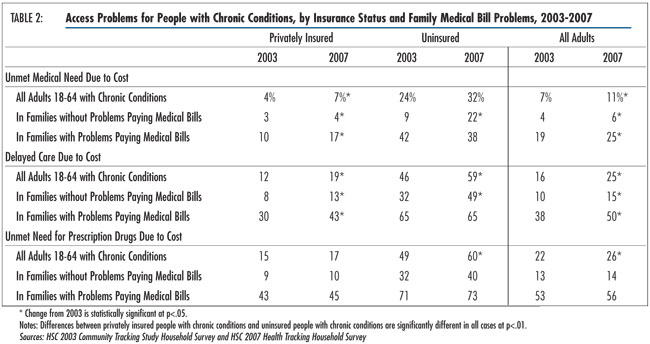
![]() mong working-age adults with chronic conditions, those
with medical bill problems were several times more likely to forgo or delay
needed care than those without medical bill problems (see Table
2). In 2007, among chronically ill people whose families had trouble paying
medical bills, one in four (5.1 million people) went without needed care, half
(10 million people) delayed needed care and 56 percent (11.3 million people)
failed to get needed prescription drugs because of cost concerns. The estimates
of unmet need and delayed care represent significant increases since 2003.
mong working-age adults with chronic conditions, those
with medical bill problems were several times more likely to forgo or delay
needed care than those without medical bill problems (see Table
2). In 2007, among chronically ill people whose families had trouble paying
medical bills, one in four (5.1 million people) went without needed care, half
(10 million people) delayed needed care and 56 percent (11.3 million people)
failed to get needed prescription drugs because of cost concerns. The estimates
of unmet need and delayed care represent significant increases since 2003.
As high as these rates of access problems are overall, problems continue to be especially acute for the uninsured. Among uninsured people with chronic conditions and medical bill problems, 38 percent went without needed care, 65 percent delayed care and 73 percent did not fill a prescription because of cost concerns.
Rates of access problems for the privately insured with medical bill problems, while lower than for the uninsured, are still considerable: 17 percent went without needed care, 43 percent delayed care and 45 percent did not fill a prescription because of cost concerns. While rates of access problems remained stable—at high levels—for the uninsured with medical debt between 2003 and 2007, unmet need and delayed care problems for the privately insured with medical debt increased significantly—a finding that is consistent with trends of increased patient cost sharing in commercial insurance during this period.4
Though less widespread, some working-age, chronically ill adults with medical bill problems reported that their medical debt prompted providers to deny care. In 2007, approximately 4 percent of working-age, chronically ill adults with medical bill problems reported that medical providers had denied them care in the past 12 months directly as a result of their medical debt (data not shown). Among uninsured, chronically ill adults with medical bill problems, 13 percent reported being denied care.
Back to Top

Click here to view this figure as a PowerPoint slide.
Implications
![]() he rising prevalence and increasing financial burden of
chronic conditions mean that more Americans than ever are forgoing or delaying
medical care because of concerns that they cannot afford treatment. The uninsured
chronically ill—most of whom are low income—bear the heaviest cost burdens and
are the most likely to put off or go without needed medical care. Access problems
for the uninsured are intensified by their poorer health status: In 2007, 51
percent of the uninsured, working-age chronically ill—nearly 5 million people—reported
being in fair or poor health, compared with 29 percent of the privately insured
chronically ill.
he rising prevalence and increasing financial burden of
chronic conditions mean that more Americans than ever are forgoing or delaying
medical care because of concerns that they cannot afford treatment. The uninsured
chronically ill—most of whom are low income—bear the heaviest cost burdens and
are the most likely to put off or go without needed medical care. Access problems
for the uninsured are intensified by their poorer health status: In 2007, 51
percent of the uninsured, working-age chronically ill—nearly 5 million people—reported
being in fair or poor health, compared with 29 percent of the privately insured
chronically ill.
While some assume that adults with serious health problems can qualify for public insurance, many chronically ill, working-age adults in poor health neither meet the stringent income requirements or eligibility categories for Medicaid nor the permanent-disability standard for Medicare. At the same time, their health conditions often make the cost of buying coverage on the individual insurance market prohibitively expensive, leaving them uninsured.
Although their access problems are not as severe as those of the uninsured, people with chronic conditions who are covered by private insurance also became more likely to report medical bill problems and to cut back on medical care because of cost concerns between 2003 and 2007.
In recent years, many employers have responded to rising health care costs by increasing patient cost sharing in the form of larger deductibles and copayments. Some employers also have pared benefits and moved from fixed-dollar copayments to percentage coinsurance. While intended to curb unnecessary utilization, higher patient cost sharing also may curtail the use of clinically valuable services that prevent or control chronic conditions. Indeed, previous research has found that higher cost sharing for prescription drugs can reduce patient compliance with medication regimens and, consequently, trigger greater use of expensive medical services, such as emergency department visits, for chronic conditions ranging from diabetes to congestive heart failure to schizophrenia.5
Such research suggests that using such blunt tools as across-the-board copayment increases may be counterproductive for employers seeking to contain health costs. In contrast, some large employers have implemented value-based benefit designs, where cost sharing is reduced or eliminated for certain drugs and preventive services deemed clinically valuable and cost effective. The evidence suggests that such an approach increases patient compliance and may yield cost savings and favorable clinical outcomes.6,7 Wider adoption of value-based benefit structures by employers and insurers may provide financial relief to many who are living with chronic conditions and struggling with high out-of-pocket expenses.
Managed care products that are restricted to narrow networks of physicians and hospitals may present another option to ease financial strain for people with chronic conditions. Such products typically offer lower premiums and reduced out-of-pocket requirements. While many consumers forcefully rejected such narrow-network products in the past, spiraling costs since then may have changed their willingness to receive care within a more restrictive environment.
In 2007, more than three in five adults with chronic conditions said they would be willing to accept a limited choice of physicians and hospitals to save money on out-of-pocket costs for health care (see Supplementary Table 3). While willingness to trade provider choice for cost savings is higher for those with medical debt problems, it is also quite high for those without debt problems, suggesting that affordability concerns are widespread even among those who have managed to stay current with their medical bills. Overall, willingness to trade choice for costs remained stable between 2003 and 2007, but higher-income people with medical debt have increased their willingness by a sizeable margin, reflecting the growing impact of cost concerns on people with middle incomes and above.
For the growing number of Americans living with chronic conditions, the outlook is not positive. The findings reported here are based on a survey conducted in 2007, before the current economic downturn. Since then, federal and state budget woes, rising unemployment, tightened credit and other economic indicators all point to worsening financial pressures and access problems for Americans living with chronic health problems.
Back to Top
Notes
Back to Top
Supplementary Tables
Supplementary Table
1: Out-of-Pocket Costs Relative to Income for Working-Age Adults With Chronic
Conditions, 2003-2007
Supplementary Table 2:
Working-Age Adults with Chronic Conditions with Medical Bill Problems by Out-of-Pocket
Spending, 2003-2007
Supplementary Table 3:
Willingness to Trade Provider Choice for Lower Costs, 2003-2007
Data Source and Funding Acknowledgements
This Tracking Report presents findings from the HSC 2007 Health Tracking Household Survey and the HSC 2001 and 2003 Community Tracking Study Household Surveys. All three surveys used nationally representative samples of the civilian, noninstitutionalized population. Sample sizes included about 60,000 people in 2001, 47,000 people in 2003 and 18,000 people in 2007. Estimates for working-age adults are based on samples of 39,000 in 2001, 30,000 in 2003 and 10,000 in 2007. Survey response rates were 59 percent in 2001, 57 percent in 2003 and 43 percent in 2007. Population weights adjust for probability of selection and differences in nonresponse based on age, sex, race/ethnicity and education. Questionnaire design and data collection methods were similar across the three surveys.
Each survey asked adult respondents whether they had been diagnosed with
one of more than 10 chronic conditions and whether they had seen a doctor in
the past two years for the condition. The list of chronic conditions includes
asthma, arthritis, diabetes, chronic obstructive pulmonary disease, heart disease,
hypertension, cancer, benign prostate enlargement, abnormal uterine bleeding
and depression. Because the list of conditions is not exhaustive, the estimate
of chronic condition prevalence is likely conservative.
Funding Acknowledgements: This research was funded by the Robert Wood Johnson Foundation. The HSC 2007 Health Tracking Household Survey and HSC 2003 and 2001 Community Tracking Study Household Surveys used for the analysis were funded by the Robert Wood Johnson Foundation.
Back to Top
TRACKING REPORTS are published by the
Center for Studying Health System Change.
600 Maryland Avenue, SW, Suite 550
Washington, DC 20024-2512
Tel: (202) 484-5261
Fax: (202) 484-9258
www.hschange.org