Americans' Access to Prescription Drugs Stabilizes, 2007-2010
Tracking Report No. 27
December 2011
Ellyn R. Boukus, Emily Carrier
Despite the weak economy and more people lacking health insurance, the proportion of Americans reporting problems affording prescription drugs remained level between 2007 and 2010, with more than one in eight going without a prescribed drug in 2010, according to a new national study from the Center for Studying Health System Change (HSC). While remaining stable overall, access to prescription drugs improved for working-age, uninsured people, likely reflecting a decline in visits to health care providers, as well as changes in the composition of the uninsured population. Likewise, elderly people eligible for both Medicare and Medicaid saw a sharp drop in prescription drug access problems. The most vulnerable people—the uninsured, those with low incomes, people in fair or poor health, and those with multiple chronic conditions—continued to face the most unmet prescription needs. For example, 48 percent of uninsured people in fair or poor health went without a prescription drug because of cost concerns in 2010, almost double the rate of insured people with the same reported health status.
- Drug Affordability Problems Stabilize
- Access Problems Vary by Insurance Coverage
- Prescription Access Improves for the Uninsured...
- ...and for Dually Eligible Seniors
- Low Income, Sicker Fare Worse
- Implications
- Notes
- Data Source and Funding Acknowledgement
Drug Affordability Problems Stabilize
![]() rescription drug therapy is a critical component of treating many medical conditions. In 2010, two-thirds of all Americans—and nearly 90 percent of seniors—reported taking at least one prescription drug in the past year.1 Although pharmaceutical spending growth has slowed in recent years, it still comprises more than 10 percent of total health care spending and is expected to accelerate in the coming years because of planned health coverage expansions and an aging population.2 As a result, prescription drug affordability is a key concern among public and private payers, policy makers, and consumers.
rescription drug therapy is a critical component of treating many medical conditions. In 2010, two-thirds of all Americans—and nearly 90 percent of seniors—reported taking at least one prescription drug in the past year.1 Although pharmaceutical spending growth has slowed in recent years, it still comprises more than 10 percent of total health care spending and is expected to accelerate in the coming years because of planned health coverage expansions and an aging population.2 As a result, prescription drug affordability is a key concern among public and private payers, policy makers, and consumers.
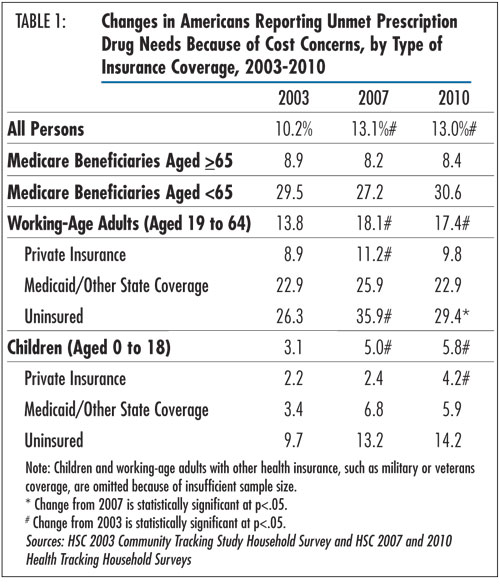
The proportion of Americans reporting problems affording prescription drugs remained unchanged at roughly 13 percent in both 2007 and 2010, according to findings from HSC’s nationally representative 2010 Health Tracking Household Survey (see Table 1 and Data Source). This translates to approximately 39 million Americans going without needed prescriptions because of cost concerns in 2010.
Given the large increase in the uninsured population—from 42.8 million in 2007 to 51.7 million in 20103—and financial pressures caused by the severe economic recession and sluggish recovery, it is somewhat surprising that drug affordability problems did not increase. The level trend in affordability problems may be a byproduct of reductions in medical care in response to the weak economy—fewer physician visits may have led to fewer prescriptions being written. At the same time, loss of patent protection for several major branded drugs and additional shifts toward generic use, as well as lower generic prices, also likely made some prescriptions more affordable for patients.
While access to prescription drugs remained stable in recent years, the number and percentage of Americans reporting unmet prescription drug needs because of cost concerns remained significantly higher in 2010 compared to 2003 (13% vs. 10%), largely reflecting an increase in access problems for children and working-age adults (aged 19-64) between 2003 and 2007.4

Access Problems Vary by Insurance Coverage
![]() nsurance coverage remained strongly related to a person’s ability to afford prescription drugs. Individuals with private insurance experienced relatively few problems, with 9.8 percent of working-age adults and 4.2 percent of children reporting an unmet prescription need in 2010. Overall, about 95 percent of people with private insurance indicated that they had prescription drug coverage in 2010 (findings not shown).
nsurance coverage remained strongly related to a person’s ability to afford prescription drugs. Individuals with private insurance experienced relatively few problems, with 9.8 percent of working-age adults and 4.2 percent of children reporting an unmet prescription need in 2010. Overall, about 95 percent of people with private insurance indicated that they had prescription drug coverage in 2010 (findings not shown).
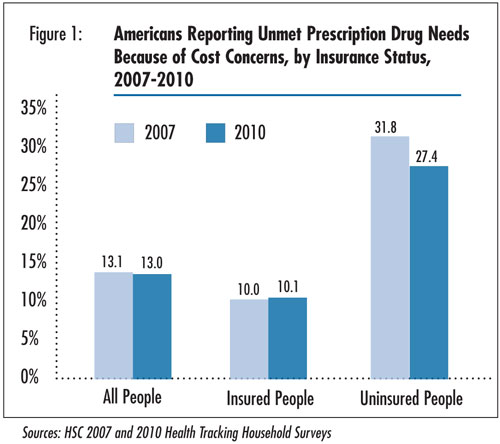
In contrast, uninsured people continued to have the most problems affording prescription drugs. Overall, 27.4 percent of uninsured people reported prescription drug access problems in 2010, or nearly three times the rate for insured people (see Figure 1). Access for the uninsured differed across age groups: about one in seven uninsured children and three in 10 uninsured working-age adults went without a prescription drug because of cost concerns. The uninsured face the highest exposure to drug costs because they typically must pay full retail price for prescriptions. Older research indicates that people without drug coverage have paid 15 percent to 20 percent more for commonly prescribed drugs than those with coverage.5 However, more recently, pharmaceutical companies, as well as state and local governments, have implemented programs to make prescription drugs more affordable for low-income people.
Access to prescription drugs among Medicare beneficiaries varied significantly by eligibility status. As in previous years, nonelderly Medicare beneficiaries, whose eligibility is based on permanent disability or severe kidney disease, fared worse than beneficiaries aged 65 and older. This difference in access problems likely reflects nonelderly Medicare beneficiaries’ more complex medical and pharmacological needs and lower incomes. In 2010, nonelderly Medicare beneficiaries were 3.6 times as likely to report an unmet prescription drug need as their elderly counterparts.
Back to Top

Prescription Access Improves for the Uninsured...
![]() hile prescription drug access remained stable for most Americans in recent years, uninsured, working-age adults saw a significant decrease in unmet prescription drug needs, from 35.9 percent in 2007 to 29.4 percent in 2010. Some portion of the decrease in access problems likely reflects that fewer uninsured people reported visiting a health care provider in 2010 compared with 2007.6 As a result, they were less likely to have the opportunity to have any medications prescribed.
hile prescription drug access remained stable for most Americans in recent years, uninsured, working-age adults saw a significant decrease in unmet prescription drug needs, from 35.9 percent in 2007 to 29.4 percent in 2010. Some portion of the decrease in access problems likely reflects that fewer uninsured people reported visiting a health care provider in 2010 compared with 2007.6 As a result, they were less likely to have the opportunity to have any medications prescribed.
Changes in the composition of the uninsured population also may have contributed to the improvement in prescription drug access for this group. Other research shows that the growth in the uninsured population between 2007 and 2010 occurred primarily among people who are healthier and have higher incomes, factors that are associated with fewer prescription drug access problems.7 However, further analysis shows that after accounting for changes in the health status, income, and other characteristics of the uninsured population, most of the decrease in prescription drug access problems among the uninsured remained.8
Back to Top
...and for Dually Eligible Seniors
![]() nother notable departure from the stable trend occurred among elderly people who are eligible for both Medicare and Medicaid coverage. After doubling between 2003 and 2007, unmet prescription drug needs for dually eligible, elderly Medicare beneficiaries dropped sharply from 21.7 percent in 2007 to 8.0 percent in 2010 (findings not shown).
nother notable departure from the stable trend occurred among elderly people who are eligible for both Medicare and Medicaid coverage. After doubling between 2003 and 2007, unmet prescription drug needs for dually eligible, elderly Medicare beneficiaries dropped sharply from 21.7 percent in 2007 to 8.0 percent in 2010 (findings not shown).
Administration of dually eligible beneficiaries’ drug plans shifted from Medicaid to Medicare Part D in January 2006. An earlier HSC study noted that lingering transition problems, such as coverage lapses and overcharging for some medications, may have contributed to the rise in access problems in 2007.9 The return to pre-implementation levels in 2010 likely reflects efforts by the Centers for Medicare and Medicaid Services to resolve transition-related obstacles. These measures included implementing prospective enrollment of new dual eligibles to avoid coverage gaps and temporary coverage of existing prescriptions to ensure uninterrupted therapy for new enrollees, allowing time for them to switch to a covered drug or obtain a formulary exception.10
Back to Top
Low Income, Sicker Fare Worse
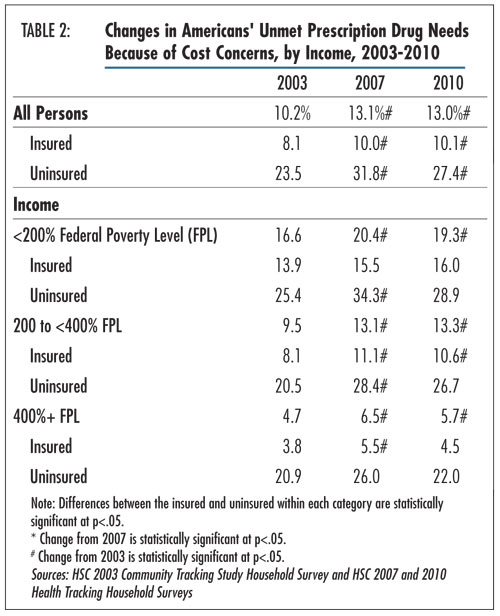
![]() nmet prescription drug needs were greater for people with the lowest incomes. In 2010, individuals with incomes below 200 percent of poverty—$—,100 for a family of four—were 3.4 times more likely to report drug access problems as those earning 400 percent of poverty or more (19.3% vs. 5.7%) (see Table 2). Unmet prescription drug needs remained steady for each income group overall between 2007 and 2010 but were still elevated compared with 2003 levels.
nmet prescription drug needs were greater for people with the lowest incomes. In 2010, individuals with incomes below 200 percent of poverty—$—,100 for a family of four—were 3.4 times more likely to report drug access problems as those earning 400 percent of poverty or more (19.3% vs. 5.7%) (see Table 2). Unmet prescription drug needs remained steady for each income group overall between 2007 and 2010 but were still elevated compared with 2003 levels.
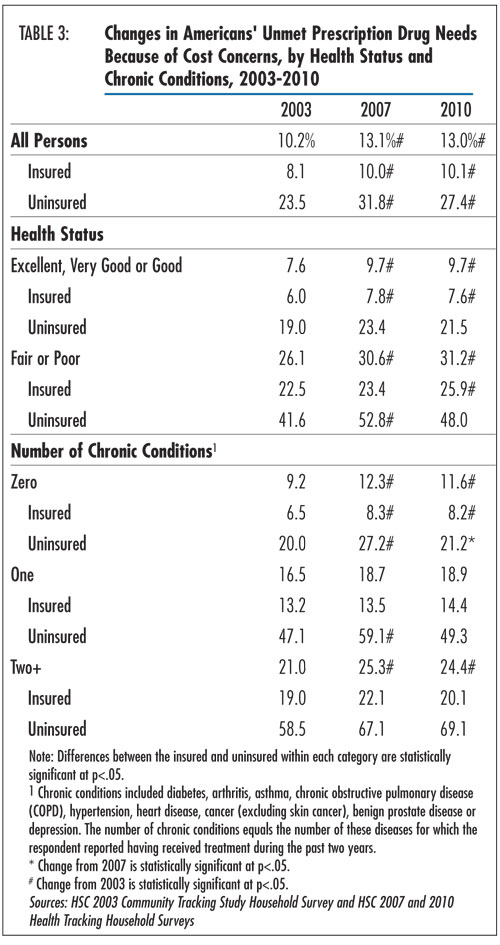
People who reported being in fair or poor health also were more likely to have gone without a prescription medication because of cost concerns (see Table 3). They were more than three times likelier to report a drug affordability problem compared with those in good, very good or excellent health (31.2% v. 9.7%). Less-healthy people were more likely to report having taken a prescription medication in the past year compared with healthier people (82.1% vs. 63.1%) and, therefore, had more opportunities to encounter a problem affording a medication (findings not shown). Uninsured people in fair or poor health had the most problems, with 48 percent reporting an unmet prescription need in 2010, almost double the rate of insured persons with the same reported health status.
Patients with multiple chronic conditions were more than twice as likely to go without a needed prescription as people without a chronic condition (24.4% vs. 11.6%). As with health status, prescription usage—and the risk of an affordability problem—increased with disease burden: 98 percent of people with multiple chronic conditions reported taking a prescription in the past year, compared with 53 percent of those without a chronic condition (findings not shown). Uninsured people with multiple chronic conditions were the most vulnerable population: 69 percent reported an unmet prescription need because of cost in 2010, compared with 20 percent of insured people with multiple chronic conditions.
Back to Top


Implications
![]() espite the weak economy, high unemployment and more uninsured Americans, reports of prescription drug affordability problems remained stable in recent years. Part of this may be a byproduct of decreased demand for medical care, especially among the uninsured. Also, trends in the pharmaceutical industry, including patent expirations and expanded use of existing generic drugs, may have helped increase the affordability of prescriptions for some. Since 2007, several major branded drugs such as Depakote—for treatment of seizures, bipolar disorder and migraine headaches—and Norvasc—for high-blood pressure and chest pain—lost patent protection and became available in generic form. Total generic market share grew from 67 percent in 2007 to 78 percent in 2010, and spending on new brands—drugs launched in the previous 24 months—declined from $10 billion in 2007 to $4 billion in 2010.11
espite the weak economy, high unemployment and more uninsured Americans, reports of prescription drug affordability problems remained stable in recent years. Part of this may be a byproduct of decreased demand for medical care, especially among the uninsured. Also, trends in the pharmaceutical industry, including patent expirations and expanded use of existing generic drugs, may have helped increase the affordability of prescriptions for some. Since 2007, several major branded drugs such as Depakote—for treatment of seizures, bipolar disorder and migraine headaches—and Norvasc—for high-blood pressure and chest pain—lost patent protection and became available in generic form. Total generic market share grew from 67 percent in 2007 to 78 percent in 2010, and spending on new brands—drugs launched in the previous 24 months—declined from $10 billion in 2007 to $4 billion in 2010.11
Another factor that likely improved drug access during this period was the growth in low-cost generic programs offered by many retail pharmacy chains. A selection of discount generics—as low as $4 for a month’s supply—provided by big-box stores and many retail pharmacy chains has increased the affordability of many medications.12 Efforts by health insurers—such as zero or reduced copayments for generic drugs and step therapy, where a generic must be tried first—also have encouraged generic use.
Moreover, pharmaceutical companies, state and local governments, and other organizations have contributed to the availability of prescription drugs for uninsured persons through prescription assistance programs that offer eligible patients access to brand-name and generic medications at little or no cost.13 These programs have grown in recent years, with the National Conference of State Legislatures reporting that the number of states offering financial assistance for prescription drugs increased from 26 in 2006 to 42 in 2009. In addition, more states are purchasing medications in bulk directly from manufacturers and distributing them at a discount to low-income and uninsured patients.14
Over the next several years, generic formulations of other blockbuster drugs—including the two most widely sold drugs in the world, Lipitor to treat high cholesterol and Plavix to reduce the risk of stroke and heart attack by preventing blood clots—are scheduled to become available. This likely will help improve the affordability of prescription medications. At the same time, increases in the cost and utilization of expensive biologic and other specialty drugs will likely add to cost concerns among certain patients with serious health conditions. Specialty drugs represent the fastest-growing segment of drug spending and are expected to comprise 40 percent of U.S. drug spending by 2014.15
In 2014, the 2010 Patient Protection and Affordable Care Act (PPACA) is expected to extend prescription drug coverage to tens of millions of uninsured Americans via expansions in Medicaid eligibility and subsidized private coverage in health insurance exchanges. Although prescription drug coverage is an “essential benefit” to be provided by health plans participating in the state health insurance exchanges, flexibility in plan design leaves room for benefit limits, including patient cost sharing, prior authorization, preferred drug lists, dispensing limits and other utilization management tools, that may affect gains in access.
Similarly, while all states provide prescription coverage under Medicaid, it is an optional benefit that is limited by cost-containment strategies in some states. An earlier HSC study discussed a variety of such policies employed by state Medicaid programs, such as use of prior authorization, limits on the number of prescriptions, higher patient cost sharing and mandatory generic substitution.16 Medicaid enrollees in states that had implemented the most aggressive policies reported greater problems accessing prescription medications. Amidst ongoing state budget problems, use of these strategies is likely to continue to pose challenges for Medicaid patients needing prescription drugs.
Other elements of PPACA may affect the affordability of prescription medications as well. Currently, Medicare Part D enrollees experience more access problems compared to those with supplemental private coverage, in part because of the “doughnut hole” coverage gap, where beneficiaries are responsible for the full cost of their prescription drugs out of pocket. Health care reform aims to close the coverage gap by incrementally reducing beneficiaries’ out-of-pocket share until it reaches 25 percent in 2020.
Back to Top
Notes
Back to Top
Data Source
This Tracking Report presents findings from the HSC 2010 and 2007 Health Tracking Household Surveys and the 2003 Community Tracking Study Household Survey. All three telephone surveys used nationally representative samples of the civilian, noninstitutionalized population. For the first time, the 2010 survey included a cell phone sample because of declining percentages of households with landline phones. Sample sizes include about 47,000 people for the 2003 survey, about 18,000 people for the 2007 and about 17,000 people for the 2010 survey. Response rates for the surveys were 57 percent in 2003, 43 percent in 2007, and 46 and 29 percent, respectively, for the landline and cell phone samples in 2010. Population weights adjust for probability of selection and differences in nonresponse based on age, sex, race or ethnicity, and education. The weights also adjust for the increased probability of selection in cases of households using both landline and cell phones. Although all three surveys are nationally representative, the sample for the 2003 survey was largely clustered in 60 representative communities, while the 2007 and 2010 surveys were based on a stratified random sample of the nation. Standard errors account for the complex sample design of the surveys. Questionnaire design, survey administration and the question wording of all measures in this study were similar across the three surveys.
Estimates of unmet need for prescription drugs were based on the following question: “During the past 12 months, was there any time you needed prescription medicines but didn’t get them because you couldn’t afford it?” Insurance status reflects coverage on the day of the interview and includes coverage obtained through employer-sponsored and individually purchased private insurance, Medicare, Medicaid, the Children’s Health Insurance Program, other state programs, TRICARE and other military insurance programs, and the Indian Health Service.
Funding Acknowledgement
This research was funded by the Robert Wood Johnson Foundation (RWJF). The HSC 2007 and 2010 Health Tracking Household Surveys and the HSC 2003 Community Tracking Study Household Survey used for the analysis also were funded by RWJF.
Back to Top
TRACKING REPORTS are published by the
Center for Studying Health System Change.
1100 1st Street, NE, 12th Floor
Washington, DC 20002
Tel: (202) 484-5261
Fax: (202) 863-1763
www.hschange.org