
| January 2003 Journal Article Journal of Ambulatory Care Management |
||
Physicians and Care Management: More Acceptance than You Think Issue Brief No. 60 |
||
Physicians More Likely to Face Quality Incentives than Incentives That May Restrain Care
Issue Brief No. 48
January 2002
Jeffrey Stoddard, Joy M. Grossman, Liza Rudell
Intent of Incentives
![]() ith the growth of managed care,
health plans and physician organizations
have adopted formal financial
incentives to influence physician
clinical decision making. Critics contend
incentives can create a conflict of
interest between physicians’ personal
financial gain and their patients’ best
interests, which could compromise
quality and patient trust. Supporters
counter that incentives to encourage
cost-effective care are necessary to
hold down overuse of services that
fuel runaway costs. Approaches such
as capitation-a fixed monthly per-patient
payment-and profiling are
the most controversial because they
can potentially lead to the denial of
necessary services.
ith the growth of managed care,
health plans and physician organizations
have adopted formal financial
incentives to influence physician
clinical decision making. Critics contend
incentives can create a conflict of
interest between physicians’ personal
financial gain and their patients’ best
interests, which could compromise
quality and patient trust. Supporters
counter that incentives to encourage
cost-effective care are necessary to
hold down overuse of services that
fuel runaway costs. Approaches such
as capitation-a fixed monthly per-patient
payment-and profiling are
the most controversial because they
can potentially lead to the denial of
necessary services.
While much attention has been focused on how health plans pay physician organizations, little is known about how physician organizations pay individual physicians. But, the financial incentives used by practices to determine individual physician compensation are likely to have stronger effects on care delivery, particularly when they are based on the physician’s own clinical performance rather than the financial performance of the group as a whole.1 Physician practices use such approaches to align the interests of individual physicians with those of the group.
This Issue Brief examines four factors used to adjust base compensation and/or bonuses that reflect how physicians treat their patients. These are productivity (a standard measure) and three performance-based measures: results of patient satisfaction surveys, quality of care measures and profiling that compares a physician’s pattern of medical resource use to that of other physicians.
Trends in Use
![]() ost physicians are not directly subject to the types of incentives
that are perceived to conflict with patients’ interests (see
Figure 1). In 1999, physicians in practices of two or more said they are less
often subject to financial incentives based on profiling (14 percent), which are
more likely to restrain use of services, than incentives based on patient satisfaction
(24 percent) and quality (19 percent), which are more likely to encourage use.
ost physicians are not directly subject to the types of incentives
that are perceived to conflict with patients’ interests (see
Figure 1). In 1999, physicians in practices of two or more said they are less
often subject to financial incentives based on profiling (14 percent), which are
more likely to restrain use of services, than incentives based on patient satisfaction
(24 percent) and quality (19 percent), which are more likely to encourage use.
Overall, physicians are much less likely to face performance-based incentives (32 percent) than the productivity incentives that have traditionally been used to determine compensation (72 percent). Performance-based incentives are often used in combination with each other and almost always in combination with productivity incentives. The prevalence in the use of financial incentives has remained remarkably stable between 1997 and 1999, with a modest but statistically significant decline in profiling.
Figure 1
Percentage of Physicians in Practices of Two or More Whose
Compensation Is Affected by Selected Financial Incentives
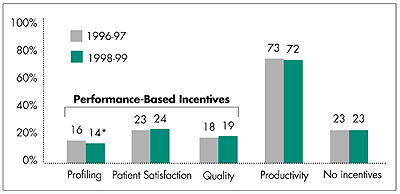
* Significant change at p<0.05 between 1996-97 and 1998-99.
Note: Sample excludes full owners of solo practices, physicians spending
less than 60 percent of their time in patient care and physicians practicing
in community health centers and city-, county- or state-owned hospitals
and clinics. Physicians may be subject to more than one incentive.
Source: Community Tracking Study Physician Survey, 1996-97 and 1998-99
Differences Across Practice Type
![]() roductivity incentives are widespread and exist across all
practice arrangements (see Table 1). While performance-based
incentives have not been widely adopted, they are much more prevalent in certain
types of practices. Physicians in group/staff-model health maintenance organizations
(HMOs) are more than three times as likely to be subject to profiling incentives
as those practicing in small or medium-sized groups and are even more likely to
be subject to patient satisfaction and/or quality incentives. Physicians in large
groups of 30 or more and those in hospital-owned and medical school practices
are also significantly more likely to face these incentives than physicians in
smaller groups, but are only about half as likely as group/staff-model HMO physicians
to do so.
roductivity incentives are widespread and exist across all
practice arrangements (see Table 1). While performance-based
incentives have not been widely adopted, they are much more prevalent in certain
types of practices. Physicians in group/staff-model health maintenance organizations
(HMOs) are more than three times as likely to be subject to profiling incentives
as those practicing in small or medium-sized groups and are even more likely to
be subject to patient satisfaction and/or quality incentives. Physicians in large
groups of 30 or more and those in hospital-owned and medical school practices
are also significantly more likely to face these incentives than physicians in
smaller groups, but are only about half as likely as group/staff-model HMO physicians
to do so.
Pressures to implement formal incentives may be stronger for group/staff-model HMOs, large groups and hospital-owned and medical school practices than for small and medium-sized group practices. This may be because these practices:
- are larger and may have more difficulty
monitoring individual physicians informally;
- have greater need to align group and
individual objectives since physicians are
more likely to be salaried employees; and/or
- are more likely to have health plan contracts with capitation or similar incentives and have more resources and data to develop performance-monitoring systems.
| Table 1 Percentage of Physicians Whose Compensation Is Affected by Selected Financial Incentives by Practice Arrangement, 1999 |
||||
| Percent of Physicians
in Practices of Two or More, By Practice Arrangement |
Incentives Based
on Individual Physician Performance |
|||
| Performance- Based |
Productivity |
|||
| Practice Arrangement | |
Profiling |
Patient Satisfaction and/or
Quality |
|
| Small Group (2-9 Physicians) | 42% |
10% |
16% |
72% |
| Medium Group (10-29 Physicians) | 10 |
10 |
18 |
70 |
| Large Group (30+ Physicians) | 8 |
14* |
32** |
81** |
| Staff/Group HMO | 7 |
33** |
70** |
65* |
| Hospital-Owned, Medical School or Other | 33 |
16** |
37** |
72 |
| All | 100 |
14 |
29 |
72 |
| * Significantly different from small groups
at p<0.05. ** Significantly different from small groups at p<0.001. Note: Sample excludes full owners of solo practices, physicians spending less than 60 percent of their time in patient care and physicians practicing in community health centers and city-, county- or state-owned hospitals and clinics. Physicians may be subject to more than one incentive. Source: Community Tracking Study Physician Survey, 1998-99 |
||||
Capitation and Individual Financial Incentives
![]() hysicians working in practices with higher levels of capitated
revenue are more likely to be subject to performance-based incentives than those
with less capitated revenue (see Table 2). Those in practices
with more than 50 percent capitation are three times as likely as those in practices
with no capitation to use profiling and more than twice as likely to use patient
satisfaction and/or quality incentives.
hysicians working in practices with higher levels of capitated
revenue are more likely to be subject to performance-based incentives than those
with less capitated revenue (see Table 2). Those in practices
with more than 50 percent capitation are three times as likely as those in practices
with no capitation to use profiling and more than twice as likely to use patient
satisfaction and/or quality incentives.
Under capitation, practices have incentives to use profiling to promote cost-effective patterns of care. Patient satisfaction and quality incentives, on the other hand, may be implemented to offset the potential risk under capitation to withhold medically necessary services.
| Table 2 Percentage of Physicians Whose Compensation Is Affected by Selected Financial Incentives, by Percentage of Practice Revenue from Capitation, 1999 |
||||
| |
Incentives Based
on Individual Physician Performance |
|||
| Performance-Based |
Productivity* |
|||
| Percentage of Practive Revenue From Capitation | |
Profiling* |
Patient Satisfaction and/or
Quality* |
|
| None | 39% |
8% |
19% |
71% |
| 1-24 | 30 |
13 |
27 |
74 |
| 25-49 | 14 |
22 |
34 |
77 |
| 50+ | 17 |
25 |
50 |
67 |
| All | 100 |
14 |
29 |
72 |
| * All comparisons are significant for linear
trend at p<0.001. Note: Sample excludes full owners of solo practices, physicians spending less than 60 percent of their time in patient care, and physicians practicing in community health centers and city-, county- or state-owned hospitals and clinics. Physicians may be subject to more than one incentive. Source: Community Tracking Study Physician Survey, 1998-99 |
||||
Policy Implications
![]() lthough there is little evidence that financial incentives
result in the withholding of necessary care, many states have passed laws governing
physician incentives, and Medicare has issued regulations barring health plans
from paying physicians to reduce or limit medically necessary services to individual
patients. Additionally, various patient-protection proposals pending in Congress
mirror Medicare regulations governing physician incentives.
lthough there is little evidence that financial incentives
result in the withholding of necessary care, many states have passed laws governing
physician incentives, and Medicare has issued regulations barring health plans
from paying physicians to reduce or limit medically necessary services to individual
patients. Additionally, various patient-protection proposals pending in Congress
mirror Medicare regulations governing physician incentives.
However, there is some evidence that incentives may be compromising patients’ trust in physicians because of potential conflicts of interest.2 As an alternative to barring such incentives, some patient-protection laws require health plans to disclose financial incentives or allow lawsuits when incentives are alleged to have resulted in withholding needed care. Many consumer advocates believe patients are entitled to disclosure and that they can make better choices about selecting physicians and treatment decisions if they are informed about the nature of the financial incentives.
Nevertheless, existing regulations focusing on health plans do not take into account incentives established by physician practices, even though they are more powerful and may augment or blunt plan incentives, particularly in large practices. However, policy makers need to think carefully about whether regulating physician organizations and incentives at the practice level makes sense, given their low prevalence and the challenge of implementing regulation at that level.
Instead of direct regulation of incentives, another approach is public disclosure of their use. Comprehensive disclosure of incentives at both the physician and practice level is very complex. Incentives can differ in terms of their relative importance and, in some cases, even conflict with each other. For example, profiling or other cost-control incentives could conflict with quality incentives, and productivity incentives with patient satisfaction incentives. Moreover, the effects of all of this on patient care are uncertain. Finally, communicating this information coherently to consumers is an enormous challenge.3, 4
There was almost no change in the use of incentives by physician practices between 1997 and 1999, and significant growth in their use seems unlikely in the short term. Furthermore, the managed care backlash has driven a decline in primary care physician employment in group/staff-model HMOs5 and a slowdown or decline in capitation6 (although these trends may be offset to some degree by continuing growth of the number of physician employees and growing practice size). Given this outlook on the use of incentives, policy makers need to carefully consider whether intervention is warranted.
Data Sources
![]() his Issue Brief presents findings
from HSC’s Community Tracking
Study Physician Survey conducted
in 1996-97 and 1998-99. It is a
nationally representative telephone
survey of non-federal, patient care
physicians who spend at least 20
hours a week in direct patient care.
The 1996-97 survey included 12,528
physicians and had a 65 percent
response rate. The 1998-99 survey
included 12,304 physicians and had
a 61 percent response rate.
his Issue Brief presents findings
from HSC’s Community Tracking
Study Physician Survey conducted
in 1996-97 and 1998-99. It is a
nationally representative telephone
survey of non-federal, patient care
physicians who spend at least 20
hours a week in direct patient care.
The 1996-97 survey included 12,528
physicians and had a 65 percent
response rate. The 1998-99 survey
included 12,304 physicians and had
a 61 percent response rate.
Notes
ISSUE BRIEFS are published by the Center for Studying Health System Change.
President: Paul B. Ginsburg
Director of Public Affairs: Richard Sorian
Editor: The Stein Group
For additional copies or to be added
to the mailing list, contact HSC at:
600 Maryland Avenue, SW
Suite 550
Washington, DC 20024-2512
Tel: (202) 554-7549
(for publication information)
Tel: (202) 484-5261
(for general HSC information)
Fax: (202) 484-9258
www.hschange.org