
Reversal of Fortune: Medicare+Choice Collides with Market Forces
Issue Brief No. 52
May 2002
Joy M. Grossman, Bradley C. Strunk, Robert E. Hurley
![]() rivate health plans’ participation in Medicare was envisioned as a way to save
taxpayers money and offer Medicare beneficiaries more choices and benefits. As
enrollment grew, there were concerns about overpayments to some private health
plans and wide geographic variation in plan payments. The Balanced Budget Act of
1997 (BBA) introduced significant payment changes and regulatory requirements
for plans participating in the newly named Medicare+Choice (M+C) program.
Since January 1999, scores of plans have reduced or ended their participation,
disrupting coverage for more than two million seniors. While the BBA often is
blamed for this turnabout, research by the Center for Studying Health System
Change (HSC) indicates private market forces also played a key role in M+C’s
growing instability.
rivate health plans’ participation in Medicare was envisioned as a way to save
taxpayers money and offer Medicare beneficiaries more choices and benefits. As
enrollment grew, there were concerns about overpayments to some private health
plans and wide geographic variation in plan payments. The Balanced Budget Act of
1997 (BBA) introduced significant payment changes and regulatory requirements
for plans participating in the newly named Medicare+Choice (M+C) program.
Since January 1999, scores of plans have reduced or ended their participation,
disrupting coverage for more than two million seniors. While the BBA often is
blamed for this turnabout, research by the Center for Studying Health System
Change (HSC) indicates private market forces also played a key role in M+C’s
growing instability.
- The Rise and Fall of Medicare+Choice
- Not ‘N Sync: Dissonance Between Payments, Costs
- Riding the Underwriting Cycle
- Waxing and Waning: Providers’ Interest in M+C
- A Bumpy Road Ahead
- Data Source
- Notes
The Rise and Fall of Medicare+Choice
![]() eginning in 1985, Medicare has allowed beneficiaries to
enroll voluntarily in private managed care health plans, usually health maintenance
organizations, which receive a fixed monthly payment for each beneficiary. Since
1996, HSC has tracked developments in Medicare managed care through site visits
every two years in 12 nationally representative U.S. communities (see
Data Source).
eginning in 1985, Medicare has allowed beneficiaries to
enroll voluntarily in private managed care health plans, usually health maintenance
organizations, which receive a fixed monthly payment for each beneficiary. Since
1996, HSC has tracked developments in Medicare managed care through site visits
every two years in 12 nationally representative U.S. communities (see
Data Source).
In 1996-97, at the time of HSC’s first round of site visits, most private health
plans described Medicare as a particularly attractive line of business, and
plan participation and enrollment were increasing in most of the 12 markets.
Many observers predicted continued program growth, but by 2000-01, momentum
had stalled in almost every market. The percentage of Medicare beneficiaries
enrolled in managed care plans nationally grew from 11 percent in December 1996
to 16.1 percent in December 1998, but then fell to 14.5 percent in December
2001. Plan participation followed a similar pattern nationally and in most HSC
markets.
Many of M+C’s trials and tribulations were attributed to the BBA—particularly
changes that slowed the growth of plan payments and imposed new reporting and
quality requirements. Less attention has been paid to the role of private market
developments in plan withdrawals. Positive market conditions before the BBA’s
passage helped to spur Medicare managed care’s growth, while declining market
conditions, especially rising health care costs, intensified the impact of BBA
policy changes. This collision of public policy and private market forces, rather
than policy changes alone, brought M+C growth to a halt.
Three market factors stand out as major contributors to M+C’s initial rise and eventual fall:
- health care cost trends;
- the commercial insurance underwriting cycle; and
- plans’ ability to negotiate discounts from providers.
Not ‘N Sync: Dissonance Between Payments, Costs
![]() ealth care costs grew slowly in the mid-1990s (see
Figure 1), thanks, in part, to the growth in managed care.1
Cost trends accelerated in the latter part of the decade, especially spending
on prescription drugs. Yet M+C payment trends followed the opposite pattern—rising
quickly in the mid-1990s, when cost growth was low, and slowing significantly
just as the rate of cost growth was increasing.
ealth care costs grew slowly in the mid-1990s (see
Figure 1), thanks, in part, to the growth in managed care.1
Cost trends accelerated in the latter part of the decade, especially spending
on prescription drugs. Yet M+C payment trends followed the opposite pattern—rising
quickly in the mid-1990s, when cost growth was low, and slowing significantly
just as the rate of cost growth was increasing.
Under Medicare’s administered pricing system, M+C payment growth for individual US counties is determined by a formula that ties annual payment rate increases to increases in spending in the traditional fee-for-service Medicare program.2 In the late 1990s, for example, large reductions in the rate of growth of provider payments under the BBA and a crackdown on Medicare fraud and abuse slowed trends in traditional program spending, which, in turn, reduced increases in M+C payment rates. Since 1998, plans in the counties with the greatest number of M+C enrollees typically have received annual increases well below cost trends.3
M+C payment rate increases also failed to account for rapidly rising spending for outpatient prescription drugs in the late 1990s. While traditional Medicare does not cover most outpatient drugs—thus, those costs are not figured into its annual growth estimates—many M+C plans offered outpatient drug coverage to attract enrollees.
These out-of-sync cost and payment trends suggest substantial variation in the profitability of M+C plans. In 1996-97, when Medicare payment growth was outstripping underlying cost growth, plans in the 12 communities studied reported M+C was attractive because of the potential for profits as payment rates grew and more Medicare beneficiaries moved into private plans. By 2000-01, however, nearly all plans in the 12 sites had seen M+C profitability decline dramatically, and some plans reported losing money.
Figure 1
Trends in M+C Spending, Commercial Premiums and Commercial Health Care Costs, 1994-2001
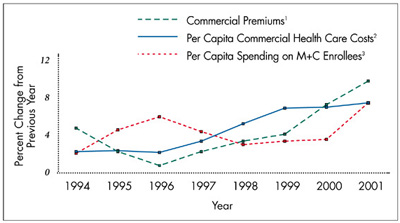
1 Premiums are for large firms with 200+ employees.
2 The 2001 estimate is for January through March, compared with corresponding months in 2000.
3 Calculated as total payments divided by total enrollment for coordinated care plans in December of each year.
Sources: Premiums—Kaiser/Health Research and Educational Trust Employer Health Benefits Survey for 1998-2001 and the KPMG survey for 1991-97; health care costs—Milliman USA Health Cost Index ($0 deductible); M+C spending—Centers for Medicare and Medicaid Services, Medicare Managed Care Contract Plans Monthly Summary Report
Riding the Underwriting Cycle
![]() ommercial insurance premium trends
tend to be higher than health care cost
trends for several years and then lower than
cost trends for several years, following a
predictable cyclical pattern known as the
insurance underwriting cycle. As profits
rise and competition heats up, plans try to
increase market share by holding down
premium increases, often causing profits
to shrink. Plans then raise premiums to
restore profitability. A new phase of the
commercial insurance underwriting cycle
began in the early 1990s, when health costs
increased more slowly than expected,
improving profitability and attracting new
plans. By 1996-97, as competition in the
commercial market intensified, many
plans in HSC markets shifted their focus
to expanding market share, and some
plans reported setting premiums below
expected costs to capture new business.
ommercial insurance premium trends
tend to be higher than health care cost
trends for several years and then lower than
cost trends for several years, following a
predictable cyclical pattern known as the
insurance underwriting cycle. As profits
rise and competition heats up, plans try to
increase market share by holding down
premium increases, often causing profits
to shrink. Plans then raise premiums to
restore profitability. A new phase of the
commercial insurance underwriting cycle
began in the early 1990s, when health costs
increased more slowly than expected,
improving profitability and attracting new
plans. By 1996-97, as competition in the
commercial market intensified, many
plans in HSC markets shifted their focus
to expanding market share, and some
plans reported setting premiums below
expected costs to capture new business.
Many plans viewed M+C participation as an attractive strategy to grow market share. In the three HSC markets with the highest M+C penetration (see Table 1), plans reported they were able to offset declining profit margins on their commercial lines of business with comfortable M+C profit margins. While M+C plans typically had offered lower beneficiary cost sharing than traditional Medicare, many plans in these markets offered additional benefits, such as outpatient prescription drug coverage, for little or no extra premium, which also attracted more enrollees.
Even in communities where plans viewed M+C products as less profitable at the time and M+C penetration was lower, Medicare represented an untapped opportunity to expand market share. Opportunities for expansion and the prospect of rapidly growing M+C payment rates helped to drive both national and local plans to enter M+C in the moderate penetration sites. National plans introduced zero-premium products with enhanced benefits in these markets. Meanwhile, local plans in most of the limited and minimal penetration sites were poised to begin offering M+C products, in part to thwart anticipated entry by national plans.
By 1999, with the BBA changes fully implemented, the health plan industry’s overall financial condition had weakened. Many plans had suffered several years of significant losses as fierce price competition in the commercial market kept premium growth below newly accelerating cost trends. To address ailing profit margins, plans switched their focus from growing market share to restoring profitability across their entire range of products. In the commercial market, plans raised premiums—aided by employers’ willingness to absorb most of these increases for their employees—reduced benefits, closed unprofitable product lines and exited certain markets.
Since plans had no control over M+C payments and believed they were limited in what they could charge beneficiaries and remain competitive, they were more constrained in their ability to address declining M+C profits. Many plans in the moderate and limited penetration markets froze enrollment, retreated from selected counties or left the program altogether. In Seattle, for example, four of six plans left M+C as of Jan. 1, 2001. Some of the moderate and limited penetration markets did receive higher payments under provisions of the Benefits Improvement and Protection Act of 2000 (BIPA), but those increases did not prevent the remaining plans in Lansing and Little Rock from withdrawing from M+C in 2002. Meanwhile, in the three markets with minimal M+C penetration, the higher payments provided by Congress under BIPA have not yet attracted new plans.
Plans that continued to offer M+C products scaled back extra benefits, particularly outpatient prescription drug coverage. They also raised premiums, although some plans chose to trim benefits to shed some less-healthy enrollees rather than raise premiums and risk losing healthier members.
In 2002, plans began to alter the last major feature that had distinguished M+C from traditional Medicare: the absence of significant cost sharing. Plans now are imposing cost sharing on basic Medicare benefits at levels that approach those of traditional Medicare. In HSC’s 12 sites, only plans in Miami—where M+C payment rates remain high—have continued to offer more generous benefits.
Table 1M+C Penetration in 12 HSC Sites
| Degree of M+C Penetration/HSC Site |
Percent of Medicare Beneficiaries Enrolled in an M+C Plan | |||
| 1996 |
1998 |
2000 |
2001 |
|
| High Penetration | ||||
| Orange Co.1 | 41.7% |
43.1% |
42.5% |
40.9% |
| Phoenix | 38.1 |
43.4 |
43.9 |
41.5 |
| Miami | 37.2 |
43.4 |
45.5 |
45.8 |
| Moderate Pentration | ||||
| Seattle | 30.5 |
33.4 |
32.5 |
25.3 |
| Boston1 | 15.5 |
23.0 |
23.7 |
21.4 |
| Cleveland | 11.6 |
22.2 |
22.4 |
18.7 |
| Limited Penetration | ||||
| Lansing | 8.7 |
12.1 |
12.4 |
11.6 |
| Little Rock | 4.6 |
9.9 |
8.9 |
7.3 |
| Northern N.J. | 4.1 |
10.0 |
8.9 |
7.5 |
| Minimal Penetration | ||||
| Indianapolis1 | 4.0 |
6.2 |
6.4 |
4.1 |
| Greenville | 0.2 |
0 |
0 |
0 |
| Syracuse | 0 |
1.1 |
1.7 |
0 |
| National | 11.0 |
16.1 |
16.5 |
14.5 |
| 1 Includes cost and demonstration plans with at least 1,000
beneficiaries. In Indianapolis, one cost plan has most of the enrollment. Note: Data are for December of each year. Enrollment is in coordinated care plans unless otherwise noted. Source: Centers for Medicare and Medicaid Services, Quarterly State/County Market Penetration Data File |
||||
Waxing and Waning: Providers’ Interest in M+C
![]() roviders’ willingness to participate in M+C plans also
made an about-face in the late 1990s. In 1996-97, providers were eager to join
Medicare managed care networks to ensure they did not lose patients or revenue
as beneficiaries moved into managed care. Plan and provider interest in risk-contracting
arrangements increased, and these arrangements were more likely to cover Medicare
beneficiaries than those who were privately insured. By 2000-01, however, some
plans had a hard time forming and sustaining M+C provider networks. In most
markets, providers said they no longer felt pressure to accept contracts for
M+C enrollees as fewer beneficiaries enrolled in the program. Some providers,
primarily dominant hospital systems and specialist groups, found their negotiating
clout strengthened, thus fueling provider pushback against plans.
roviders’ willingness to participate in M+C plans also
made an about-face in the late 1990s. In 1996-97, providers were eager to join
Medicare managed care networks to ensure they did not lose patients or revenue
as beneficiaries moved into managed care. Plan and provider interest in risk-contracting
arrangements increased, and these arrangements were more likely to cover Medicare
beneficiaries than those who were privately insured. By 2000-01, however, some
plans had a hard time forming and sustaining M+C provider networks. In most
markets, providers said they no longer felt pressure to accept contracts for
M+C enrollees as fewer beneficiaries enrolled in the program. Some providers,
primarily dominant hospital systems and specialist groups, found their negotiating
clout strengthened, thus fueling provider pushback against plans.
To keep providers, many plans were forced to pay higher rates. Stung by several years of flat payments and rising costs, many providers who had managed care risk contracts with plans were particularly eager to renegotiate terms or end contracts for both M+C and commercial enrollees. With providers demanding higher payments and better contract terms, some plans—including those in Cleveland, Indianapolis and Seattle—struggled to keep M+C networks intact while maintaining profitability.
A Bumpy Road Ahead
The near-term outlook for Medicare’s ability to retain and attract plans appears bleak with the 2003 M+C payment increase set at 2 percent for virtually all US counties and no sign of a slowdown in cost growth.4
Calls for stabilization of M+C come from many sources and include proposals for short-term measures to increase plan payments through so-called givebacks. If policy makers wish to preserve Medicare’s relationship with private health plans over the longer term, however, they need to consider reforms that would make M+C payment rates more responsive to changing marketplace conditions to ensure that beneficiaries have stable and affordable choices.
Long-term M+C reform proposals include:
- Modifying the current administered pricing system. One proposal would
set county M+C payments at 100 percent of spending in the traditional Medicare
program.5 This approach is not likely to stabilize
plan participation over time because payment trends would continue to be linked
to the "legislative cycle of alternating payment reductions and givebacks" 6 in the traditional program rather than trends in plan costs.
- Severing the link to the traditional program. This could be achieved
through a new administered pricing mechanism that would set payments much
the same way they are set for providers under the traditional program to reflect
underlying costs, along with performance incentives to improve quality of
care.7 Such a mechanism might improve plan participation if it could be designed
to reflect cost trends more accurately.
- Introducing competitive bidding that uses plan bids to set payments rather than relying on a formula-driven rate. This also might diminish instability in plan participation by linking M+C payments more closely to plan estimates of their underlying costs.
Under any of the options, policy makers would need to protect Medicare beneficiaries from undesirable fluctuations in costs, benefits and provider networks as private plans respond to changes in payments in the context of broader market forces. Even with more stable plan participation, some plans still would decide to exit the program, and safeguards would be needed to reduce beneficiary disruptions.
Data Source
![]() SC interviews community leaders
about how the health system is
changing in the following 12 sites:
Boston; Cleveland; Greenville, S.C.;
Indianapolis; Lansing, Mich.; Little
Rock, Ark.; Miami; northern New
Jersey; Orange County, Calif.;
Phoenix; Seattle; and Syracuse, N.Y.
Site visits were conducted in 1996-97,
1998-99 and 2000-01.
SC interviews community leaders
about how the health system is
changing in the following 12 sites:
Boston; Cleveland; Greenville, S.C.;
Indianapolis; Lansing, Mich.; Little
Rock, Ark.; Miami; northern New
Jersey; Orange County, Calif.;
Phoenix; Seattle; and Syracuse, N.Y.
Site visits were conducted in 1996-97,
1998-99 and 2000-01.
Notes
Web-Exclusive Data Tables for Issue Brief No. 52
ISSUE BRIEFS are published by the Center for Studying Health System Change.
President: Paul B. Ginsburg
Director of Public Affairs: Richard Sorian
Editor: The Stein Group
For additional copies or to be added
to the mailing list, contact HSC at:
600 Maryland Avenue, SW
Suite 550
Washington, DC 20024-2512
Tel: (202) 554-7549
(for publication information)
Tel: (202) 484-5261
(for general HSC information)
Fax: (202) 484-9258
www.hschange.org