
Who Do You Trust? Americans' Perspectives on Health Care, 1997-2001
Tracking Report No. 3
August 2002
Marie C. Reed, Sally Trude
![]() turbulent backlash against managed care in the mid-1990s
pitted consumers and health care providers against health plans in a struggle
for control over medical decision making. New findings from the Center for Studying
Health System Change (HSC) Community Tracking Study Household Survey indicate
consumer confidence in the system and trust in physicians increased slightly
between 1997 and 2001, perhaps as a result of changes in laws and loosening
of health plan restrictions. Nevertheless, there is strong evidence of continued
public concern about the influence of health plans on medical decision making.
For example, the level of trust in their physicians among people in fair or
poor health has not increased, and more than 40 percent of privately insured
Americans continue to believe their doctor is strongly influenced by health
plan rules when deciding about their care.
turbulent backlash against managed care in the mid-1990s
pitted consumers and health care providers against health plans in a struggle
for control over medical decision making. New findings from the Center for Studying
Health System Change (HSC) Community Tracking Study Household Survey indicate
consumer confidence in the system and trust in physicians increased slightly
between 1997 and 2001, perhaps as a result of changes in laws and loosening
of health plan restrictions. Nevertheless, there is strong evidence of continued
public concern about the influence of health plans on medical decision making.
For example, the level of trust in their physicians among people in fair or
poor health has not increased, and more than 40 percent of privately insured
Americans continue to believe their doctor is strongly influenced by health
plan rules when deciding about their care.
- Losing Faith
- More Trust In Doctors
- More Freedom To Choose Doctors
- No Progress For Those In Poor Health
- Fewer People Change Doctors
- Health Plan Changes Stabilize
- Prospects For The Future
- Data Source
- Notes
Losing Faith
![]() he managed care backlash of the mid-1990s fueled changes
in the health care system and led to passage of numerous state patient protection
laws throughout the country. Struggling to constrain health care costs, health
plans and employers had introduced restrictions on consumer access, such as
limiting the choice of in-network physicians and requiring referrals by gatekeepers
to see a specialist. Other efforts, such as physician profiling, utilization
management and capitated payments—or paying providers a fixed monthly amount
to provide care—attempted to change physician behavior. Both patients and
providers reacted negatively to these efforts. Consumers enrolled in managed
care plans were less likely to trust that their physician would "put [the] patient’s
health and well-being above keeping down the health plan’s costs" than were
those in traditional indemnity plans.1
he managed care backlash of the mid-1990s fueled changes
in the health care system and led to passage of numerous state patient protection
laws throughout the country. Struggling to constrain health care costs, health
plans and employers had introduced restrictions on consumer access, such as
limiting the choice of in-network physicians and requiring referrals by gatekeepers
to see a specialist. Other efforts, such as physician profiling, utilization
management and capitated payments—or paying providers a fixed monthly amount
to provide care—attempted to change physician behavior. Both patients and
providers reacted negatively to these efforts. Consumers enrolled in managed
care plans were less likely to trust that their physician would "put [the] patient’s
health and well-being above keeping down the health plan’s costs" than were
those in traditional indemnity plans.1
In reaction to concerns underlying the managed care backlash, states introduced and passed a variety of patient protection laws, including rules mandating direct access to some specialists, provisions for obtaining the services of out-of-network physicians, financial incentive disclosure requirements and external reviews allowing consumers to appeal health plan decisions. Health plans also responded by offering broader physician networks and dropping or curtailing prior authorization requirements. Plans relaxed other preauthorization and concurrent utilization management controls and came to rely less on capitation, which was perceived by many as encouraging providers to stint on care.
While concerns that prompted the managed care backlash among consumers have eased, perceptions about health plans’ influence on medical decision making have not changed substantially since 1997 (see Table 1). Throughout 1997-2001, nearly 45 percent of privately insured Americans agreed that their doctor is strongly influenced by health insurance company rules when making decisions about their medical care (see Data Source). During this time, people in health maintenance organizations (HMOs) were considerably more likely than those in other types of plans to believe their health plan strongly influenced their doctor. In 2001, nearly half of HMO enrollees believed their doctor was strongly influenced by health plan rules, compared with less than 40 percent of those in other types of plans. Over time, however, HMO members grew marginally less likely to report health plan influence in medical decision making.| TABLE 1: Privately Insured Americans’ Trust in Their Doctor1 | |||
| 1997 |
1999 |
2001 |
|
| Think My Doctor Is Strongly Influenced by Health Plan2 | 43.8% |
44.7% |
43.9% |
| HMO Enrollees | 50.2 |
50.8 |
48.9* |
| Non-HMO Enrollees | 38.0 |
37.7 |
38.4 |
| Persons in Fair/Poor Health | 48.9 |
48.5 |
50.4 |
| Persons in Good+ Health | 43.4 |
44.4* |
43.2* |
| Trust My Doctor to Put My Needs First | 91.6 |
92.1 |
92.9* # |
| HMO Enrollees | 89.9 |
90.7* |
92.0* # |
| Non-HMO Enrollees | 93.2 |
93.6 |
93.9 # |
| Persons in Fair/Poor Health | 87.4 |
87.2 |
87.8 |
| Persons in Good+ Health | 92.0 |
92.5* |
93.4* # |
| Think My Doctor May Not Refer to Specialist | 14.3 |
14.0 |
13.3 # |
| HMO Enrollees | 18.0 |
17.0 |
16.0 # |
| Non-HMO Enrollees | 10.9 |
10.7 |
10.4 |
| Persons in Fair/Poor Health | 21.3 |
20.0 |
20.0 |
| Persons in Good+ Health | 13.6 |
13.5 |
12.7* # |
| Note: Comparisons between HMO and non-HMO and
between fair/poor health and good+ health subgroups are significantly different
in all cases at p<.05. 1 Percent of privately insured nonelderly persons with a usual physician or a doctor visit in the past year who agree with statement. 2 See note in Data Source on page 2 for specific wording of statements. * Change from previous period is statistically significant at p<.05. # Change from 1997 to 2001 is statistically significant at p<.05. Source: HSC Community Tracking Study Household Survey |
|||
Back to Top
More Trust In Doctors
![]() lthough perceptions of health plan influence on medical
decision making did not change, privately insured
Americans in 2001 were more likely to agree their doctor
would put their medical needs above all other considerations
than they had been in 1997. This improvement in
patients’ trust in their doctors may be a result of managed
care plans’ loosened restrictions and other changes.
Between 1997 and 2001, the proportion of people
enrolled in HMOs who trusted their doctors to put their
needs first rose from 90 percent to 92 percent. In contrast,
the trust level of those in non-HMOs increased by
less than one percentage point to 94 percent. In other
words, the trust gap between HMO and non-HMO
enrollees narrowed slightly.
lthough perceptions of health plan influence on medical
decision making did not change, privately insured
Americans in 2001 were more likely to agree their doctor
would put their medical needs above all other considerations
than they had been in 1997. This improvement in
patients’ trust in their doctors may be a result of managed
care plans’ loosened restrictions and other changes.
Between 1997 and 2001, the proportion of people
enrolled in HMOs who trusted their doctors to put their
needs first rose from 90 percent to 92 percent. In contrast,
the trust level of those in non-HMOs increased by
less than one percentage point to 94 percent. In other
words, the trust gap between HMO and non-HMO
enrollees narrowed slightly.
Back to Top
More Freedom To Choose Doctors
![]() key aspect of consumer satisfaction with health
care is patients’ ability to select their provider. With the rise of managed
care, consumers faced the choice of seeing their regular doctor and paying more—sometimes
considerably more—or going to a different doctor under contract with their
health plan. Many patients also found they could not go to a specialist without
first getting a referral from a primary care physician.
key aspect of consumer satisfaction with health
care is patients’ ability to select their provider. With the rise of managed
care, consumers faced the choice of seeing their regular doctor and paying more—sometimes
considerably more—or going to a different doctor under contract with their
health plan. Many patients also found they could not go to a specialist without
first getting a referral from a primary care physician.
More recently, regulatory and marketplace changes have loosened restrictions on provider choice, and consumers appear to have noticed. In 1997, for example, 67 percent of the privately insured were very satisfied with the choice of primary care physicians available to them through their health plans (see Table 2). By 2001, the figure had risen to 70 percent, with most of the increase occurring among HMO enrollees. In contrast, the percentage of privately insured people who were satisfied with the choice of specialists available in their plan remained constant—about 72 percent—throughout the 1997-2001 period.
In response to the managed care backlash, some plans dropped gatekeeping arrangements or permitted direct access to certain types of specialists. Some states also passed legislation mandating standing referrals so people with chronic conditions did not need to get a referral each time they wanted to see a specialist for ongoing care. Some states required direct access to all or certain types of specialists, such as obstetrician-gynecologists. Patients in HMOs were less likely in 2001 to believe their doctor might not refer them to a specialist when needed, while no such decline was noted among non-HMO enrollees, evidence of weakened managed care.
These changes occurred when premium increases were relatively small and many employers, facing a tight labor market, chose to absorb much of the cost increases. Premium increases are now much higher—in part to cover the costs of loosened restrictions—and employers are looking for ways to hold down costs.
| TABLE 2: Americans’ Satisfaction with Choice of Physicians Available in Health Plans1 | |||
| 1997 |
1999 |
2001 |
|
| Very Satisfied with Choice of Primary Care Physicians in Plan | 67.4% |
68.2%* |
69.8%* # |
| Very Satisfied with Choice of Specialists in Plan | 72.7 |
72.5 |
71.8 |
| 1 Percent of privately insured nonelderly
persons. * Change from previous period is statistically significant at p<.05. # Change from 1997 to 2001 is statistically significant at p<.05. Source: HSC Community Tracking Study Household Survey |
|||
Back to Top
No Progress For Those In Poor Health
![]() n general, people in fair to poor health—those most
likely to need and use medical care—are somewhat less likely to trust the
health care system. Americans in poorer health are considerably more likely
to see strong health plan influence on their doctors’ decisions: more than 50
percent in 2001, compared with 43 percent for those in good health.
n general, people in fair to poor health—those most
likely to need and use medical care—are somewhat less likely to trust the
health care system. Americans in poorer health are considerably more likely
to see strong health plan influence on their doctors’ decisions: more than 50
percent in 2001, compared with 43 percent for those in good health.
In addition, evaluations of trust in their doctors did not improve between 1997 and 2001 for those in poorer health, in contrast to reports of healthier people. While the percentage of people in good health who trusted their doctor to put their needs first rose slightly to 93 percent in 1997, the rate remained at 88 percent through the 1997-2001 period among those in fair or poor health. Referral concerns also have not improved for those in poorer health, in contrast with the experience of those in better health. And the rate of concern differs substantially by health status: 13 percent of the healthy reported referral concerns in 2001, compared with 20 percent of those in fair to poor health.
It is not known to what extent these differences are caused by actual experience with the health care system and to what extent the mistrust of those with little need for health care declined as a result of consumers hearing fewer managed care horror stories. But it is clear that those in poorer health are less trusting of the health care system, and that recent changes have not lessened their concerns.
Back to Top
Fewer People Change Doctors
![]() nother consumer concern expressed during the managed care
backlash was the potential for a loss of continuity of care when a doctor was
no longer under contract to a health plan. People also change doctors to obtain
care that best meets their needs. Between 1997 and 2001, the percentage of privately
insured people who changed their health care provider decreased from 12 percent
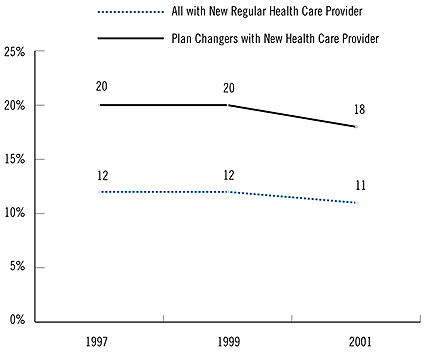
to 11 percent (see Figure 1). Even among consumers who
switched health plans—voluntarily or involuntarily—fewer changed doctors
in 2001 than in 1997 (20% in 1997, compared with 17.5% in 2001).
nother consumer concern expressed during the managed care
backlash was the potential for a loss of continuity of care when a doctor was
no longer under contract to a health plan. People also change doctors to obtain
care that best meets their needs. Between 1997 and 2001, the percentage of privately
insured people who changed their health care provider decreased from 12 percent
to 11 percent (see Figure 1). Even among consumers who
switched health plans—voluntarily or involuntarily—fewer changed doctors
in 2001 than in 1997 (20% in 1997, compared with 17.5% in 2001).
Moreover, people were much less likely in 2001 than in 1997 to attribute their change of doctors to their health plan (29% in 1997, compared with 24% in 2001) (see Table 3). The decline was particularly noteworthy for HMO members (37% in 1997, 28% in 2001), probably reflecting broadened health plan networks that included more providers.
| TABLE 3: Reasons for Privately Insured Americans’ Changes in Health Care Providers and Health Plans | |||
| 1997 |
1999 |
2001 |
|
| Principal Reason for Changing Health Care Provider1 | |||
| Health Insurance2 | 29.2% |
21.4%* |
23.5% # |
| Improved Quality | 24.7 |
23.4 |
22.6 |
| Reasons for Changing Private Health Plan3 | |||
| Cheaper Plan | 19.3 |
13.0* |
12.4 # |
| Better Services | 12.6 |
12.1 |
8.9* # |
| Change in Employer Offerings | 36.6 |
36.1 |
38.6* |
| Changed Jobs | 31.9 |
35.7 |
36.0* # |
| 1 Percent of nonelderly privately insured
persons who changed providers. 2 Includes changes in plans offered by employers, doctor no longer in plan and other reasons related to health insurance. 3 Percent of nonelderly persons with private insurance coverage throughout past 12 months who changed plans. Consumers can give more than one reason for changing plans. * Change from previous period is statistically significant at p<.05. # Change from 1997 to 2001 is statistically significant at p<.05. Source: HSC Community Tracking Study Household Survey |
|||
Back to Top
Health Plan Changes Stabilize
![]() onsumers also can be disrupted when their employers change
health plan offerings due to cost, quality, worker dissatisfaction or health
plan bankruptcy or consolidation. More Americans reported changing private health
plans in 1999 than in 1997 (up from 16.7% to 18.4%), but the rate of switching
plans remained steady after that. In 2001, 18 percent of privately insured consumers
reported changing health insurance plans in the previous 12 months.
onsumers also can be disrupted when their employers change
health plan offerings due to cost, quality, worker dissatisfaction or health
plan bankruptcy or consolidation. More Americans reported changing private health
plans in 1999 than in 1997 (up from 16.7% to 18.4%), but the rate of switching
plans remained steady after that. In 2001, 18 percent of privately insured consumers
reported changing health insurance plans in the previous 12 months.
People were more likely to change plans because they or their spouse changed jobs in 2001 than they were in 1997. At the same time, consumers were less apt to switch to obtain a cheaper plan. With broader physician networks, fewer people had to switch plans to keep their doctor. As a result, people were less likely to attribute their switching of plans to a desire to obtain better services. Finally, while changes in employers’ health plan offerings remained the most important reason why people changed plans—more than 35 percent—this proportion did not change between 1997 and 2001.
Back to Top
Prospects For The Future
![]() n response to consumer concerns, health plans broadened
their networks and lessened restrictions. These changes came at a cost. Employers
now face double-digit premium increases and must make tough choices to rein
in health care costs.
n response to consumer concerns, health plans broadened
their networks and lessened restrictions. These changes came at a cost. Employers
now face double-digit premium increases and must make tough choices to rein
in health care costs.
If employers choose to pass cost increases on to their workers, more people may choose to change plans to keep their premiums down. Alternatively, employers may give workers the choice to pay more for broader choice by offering plans with tiered provider networks. With consumers instead of health plans making the cost-choice tradeoff, another backlash may be averted, at least among those in good health. Because they have many more health care visits, those in fair to poor health may find it less palatable than others to make such tradeoffs.
Back to Top
Data Source
![]() his Tracking Report presents findings from the HSC Community
Tracking Study Household Survey, a nationally representative telephone
survey of the civilian, noninstitutionalized population conducted
in 1996-97, 1998-99 and 2000-01. For discussion and presentation,
we refer to a single calendar year of the survey
(1997, 1999 and 2001). Data were supplemented
by in-person interviews of households without
telephones to ensure proper representation.
Each round of the survey contains information
on about 60,000 people, and the response
rates ranged from 60 percent to 65 percent.
his Tracking Report presents findings from the HSC Community
Tracking Study Household Survey, a nationally representative telephone
survey of the civilian, noninstitutionalized population conducted
in 1996-97, 1998-99 and 2000-01. For discussion and presentation,
we refer to a single calendar year of the survey
(1997, 1999 and 2001). Data were supplemented
by in-person interviews of households without
telephones to ensure proper representation.
Each round of the survey contains information
on about 60,000 people, and the response
rates ranged from 60 percent to 65 percent.
Table 1 reflects responses to the following specific statements: "I think my doctor is strongly influenced by health insurance company rules when making decisions about my medical care." "I trust my doctor to put my medical needs above all other considerations when treating my medical problems." "I think my doctor may not refer me to a specialist when needed."
Back to Top
Notes
| 1. | Kao, Audiey C., et al., “The Relationship Between Method of Physician Payment and Patient Trust,” Journal of the American Medical Association, Vol. 280, No. 19 (Nov. 18, 1998). |
TRACKING REPORTS are published by the Center for Studying Health System Change.
President: Paul B. Ginsburg
Director of Public Affairs: Richard Sorian
Editor: The Stein Group
For additional copies or to be added to the mailing list, contact HSC at:
600 Maryland Avenue, SW
Suite 550
Washington, DC 20024-2512
Tel: (202) 554-7549 (for publication information)
Tel: (202) 484-5261 (for general HSC information)
Fax: (202) 484-9258
www.hschange.org