
Behind the Times: Physician Income, 1995-99
Data Bulletin No. 24
March 2003
Marie C. Reed, Paul B. Ginsburg
![]() etween 1995 and 1999, at a time when most wages and salaries
in the United States were rising sharply, average physician net income from
the practice of medicine, adjusted for inflation,1
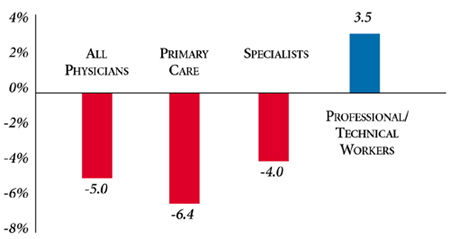
dropped 5.0 percent (see Figure 1). The reduction of
6.4 percent in primary care physicians’ average real income was particularly
notable and greater than the 4.0 percent drop for specialists.
etween 1995 and 1999, at a time when most wages and salaries
in the United States were rising sharply, average physician net income from
the practice of medicine, adjusted for inflation,1
dropped 5.0 percent (see Figure 1). The reduction of
6.4 percent in primary care physicians’ average real income was particularly
notable and greater than the 4.0 percent drop for specialists.
The decline in physicians’ income stands in stark contrast to the trends experienced by workers in professional, specialty and technical occupations.2 Between 1995 and 1999, wages and salaries for these workers rose 3.5 percent after adjusting for inflation. These trends also represent a dramatic shift from 1991 to 1995, when physicians’ income growth3 exceeded inflation, and income for other professional occupations lagged the cost of living.
Despite the decline in real income experienced during the late 1990s, medicine remains one of the highest paid professions in the United States:More than half of all patient care physicians earned more than $150,000 in 1999, while average reported net income was approximately $187,000 (see Table 1). Specialists—particularly those who perform expensive procedures—earned considerably more than other doctors. The mean reported income in 1999 for specialists was $219,000, compared with $138,000 for primary care physicians.
Figure 1
Percent Change in Average Physician Income,
Adjusted for Inflation, 1995-99
Note: Physician income data are based on reported net income from the
practice of medicine (after expenses and before taxes). The Bureau of Labor
Statistics (BLS) Employment Cost Index of wages and salaries for private "professional,
technical and specialty" workers was used to calculate estimates for these workers.
Data were adjusted for inflation using the BLS online inflation calculator.
http://146.142.4.24/cgi-bin/cpicalc.pl. Comparison year is 1995.
Sources: HSC Community Tracking Study Physician Survey
| TABLE 1: Physicians’ Net Income from Practice of Medicine, 1999, and Percent Change, 1995-99 | ||||
| |
Average Reported Net Income |
Percent Change in Income, Adjusted for Inflation |
||
| |
1999 |
1995-97 |
1997-99 |
1995-99 |
| All Patient Care Physicians | $187,000 |
-3.8%* |
-1.2% |
-5.0%* |
| Primary Care Physicians | 138,000 |
-5.4* |
-1.1 |
-6.4* |
| Specialists | 219,000 |
-3.5*# |
-0.6 |
-4.0*# |
| * Rate of change is statistically significant
at p<.05. # Rate change for specialists is significantly different from change for primary care physicians at p<.05. Notes: Reported net income: Income from practice of medicine after expenses and before taxes. Income reports are lagged. For example, in the 2000-01 survey, physicians reported annual net income from practice of medicine for 1999. Real income: Reported net income adjusted for inflation. Inflation adjustments based on the BLS online inflation calculator, http://146.142.4.24/cgi-bin/cpicalc.pl. Comparison year is 1995. Sources: HSC Community Tracking Study Physician Survey |
||||
Factors Influencing Trends
![]() he growth of managed care is a likely factor behind the decline in real income
for physicians. During this period, managed care plans successfully held down
spending for medical care by pressing providers for lower prices and restraining
utilization of services. Medicare also held down its fees during this period.
he growth of managed care is a likely factor behind the decline in real income
for physicians. During this period, managed care plans successfully held down
spending for medical care by pressing providers for lower prices and restraining
utilization of services. Medicare also held down its fees during this period.
Pressures on physician income from managed care abated in the latter part of the 1990s as managed care became less restrictive. In fact, the volume of physician services (excluding Medicare) grew at an average annual rate of 2.7 percent between 1997 and 1999 after rising only 1.4 percent a year between 1995 and 1997. The fees physicians received for their services rose 2.1 percent a year in 1997-99 after a 1.1 percent annual growth rate in 1995-97. As a result, the decline in physician income slowed during the latter period. And larger increases in the volume of physician services in 2000 and 2001 may have led to higher physician income in those years. 4
That primary care physicians’ income declined at a greater rate than did specialists’ is surprising. In 1998, Medicare adopted policies designed to benefit primary care physicians over surgical specialists, and private health plans often follow Medicare’s structure of relative payments for different services. The effects of those policies may have been offset by managed care plans’ retreat from a broader role for primary care physicians and toward providing enhanced access to specialists. In addition, technological change has long tended to boost earnings of specialists more than those of primary care physicians.
Policy Implications
![]() he real-dollar decline in physicians’ income may help
to explain the intensity of organized medicine’s objections to recent cuts in
payment rates in Medicare as well as decreased physician participation in charity
care.5 Congress recently canceled the 2003 cut and
provided a small increase in physicians’ fees, but the mechanism for setting
payment updates is still in place, so the issue may be back in 2004.
he real-dollar decline in physicians’ income may help
to explain the intensity of organized medicine’s objections to recent cuts in
payment rates in Medicare as well as decreased physician participation in charity
care.5 Congress recently canceled the 2003 cut and
provided a small increase in physicians’ fees, but the mechanism for setting
payment updates is still in place, so the issue may be back in 2004.
Physician incomes have never been an explicit consideration in setting Medicare payment policy. Since 1989, the policy has varied fee updates according to how trends in the spending for physicians’ services have compared to a target. But the experience with the sharp decline in payment rates in 2002 and the prospect of additional declines thereafter has introduced a new element in policy—trends in beneficiary access to care. To the extent that trends in income influence physicians’ willingness to serve Medicare patients, then income may play a more prominent role in policy.
Notes
| 1. | Adjustments for inflation use the Bureau of Labor Statistics (BLS) online inflation calculator, http://146.142.4.24/cgi-bin/ cpicalc.pl; 1995 is used as the reference year. |
| 2. | Changes in wage/salary income for private sector "professional, specialty and technical" workers are based on the BLS Employment Cost Index, http://data.bls. gov/labjava/ outside.jsp?survey=ec. Trends were similar for "executive, administrative and managerial" workers as well as for all workers in the private sector. |
| 3. | Unadjusted physician income data for 1991-95 from American Medical Association, Physician Socioeconomic Statistics, 2000-2002 edition (2001). |
| 4. | Data from the BLS Producer Price Index for "offices of physicians" and The Milliman USA Health Cost Index were used to calculate estimates of changes in physician prices and volume of services. Estimates were based on methods similar to those used for hospital spending in "Tracking Health Care Costs: Growth Accelerates Again in 2001" by Bradley C. Strunk, Paul B. Ginsburg and Jon R. Gabel, Health Affairs,Web-exclusive publication, Sept. 25, 2002, www.healthaffairs.org. |
| 5. | Cunningham, Peter, Mounting Pressures: Physicians Serving Medicaid Patients and the Uninsured, 1997-2001, Tracking Report No. 6, Center for Studying Health System Change, Washington, D.C. (December 2002). |
Data Source
This Data Bulletin is based on physicians’ reports of net income from the practice of medicine from the HSC Community Tracking Study Physician Survey in 1996-97, 1998-99 and 2000-01. Net income equals income from the practice of medicine after expenses and before taxes. Reported income is lagged-for example, in the 2000-01 survey, physicians provide 1999 net income. Adjustments for inflation use the Bureau of Labor Statistics (BLS) online inflation calculator.
Supplementary Table
Supplementary Table 1: Average Reported Physician Income, 1995-99
Data Bulletins are published by the Center for Studying Health System Change (HSC)
President: Paul B. Ginsburg