Who Has a Choice of Health Plans?
Issue Brief No. 27
February 2000
Sally Trude
![]() olicy makers are concerned that consumers have no voice in the changing health care
system. They debate, however, whether the consumers’ voice should be heard through
regulation, such as patient protections, or the marketplace. For market forces to work in
the consumers’ interest, consumers must have a choice of plans and detailed information on
which to base their choice. New survey data from the Center for Studying Health System
Change (HSC) suggest that more consumers have a choice of plans than is generally
believed, and that the proportion of consumers who have plan choice is increasing.
According to HSC’s 1998-1999 Household Survey, 64 percent of families have a choice of
health plans- two percentage points higher than two years ago.
olicy makers are concerned that consumers have no voice in the changing health care
system. They debate, however, whether the consumers’ voice should be heard through
regulation, such as patient protections, or the marketplace. For market forces to work in
the consumers’ interest, consumers must have a choice of plans and detailed information on
which to base their choice. New survey data from the Center for Studying Health System
Change (HSC) suggest that more consumers have a choice of plans than is generally
believed, and that the proportion of consumers who have plan choice is increasing.
According to HSC’s 1998-1999 Household Survey, 64 percent of families have a choice of
health plans- two percentage points higher than two years ago.
The Extent of Choice
![]() s managed care and increased competition
among health plans transform the health care system, policy makers, advocates and others
are concerned about what role - if any - consumers are playing in this transformation. If
consumers are to be active forces in the changing health care market, they must be able to
choose a health plan that suits their needs. Yet, many consumers are restricted to a
single health plan offered to them by their employer. If too few consumers have a choice,
plans are under little pressure to respond to consumers’ interests.
s managed care and increased competition
among health plans transform the health care system, policy makers, advocates and others
are concerned about what role - if any - consumers are playing in this transformation. If
consumers are to be active forces in the changing health care market, they must be able to
choose a health plan that suits their needs. Yet, many consumers are restricted to a
single health plan offered to them by their employer. If too few consumers have a choice,
plans are under little pressure to respond to consumers’ interests.
Choice of health plans also figures heavily in consumers’ satisfaction with their current plan. Some have suggested that the managed care backlash stems more from consumers’ lack of choice than from their experiences with managed care. Studies have shown that consumers are more satisfied with their health plan, regardless of the type of plan and its restrictions, provided they have a choice of plans. 1
Estimates of how many workers who are offered insurance by their employer have a choice of plans vary widely, from 42 percent to more than 60 percent, depending on the information source and how choice is estimated.2 Most estimates of who has plan choice are too low because they only count the proportion of employees who are offered a choice of health plans at work. The Household Survey shows that only 53 percent of employees who are offered employer-sponsored insurance have a choice of plans through their employer.
Yet, health insurance typically extends to the entire family, so these estimates overlook the full range of options available to the family when both spouses are employed. For example, the husband may be offered a single plan through his employer, while the wife is offered another plan through her employer.3 As employees, they do not have a choice, but as a family they have a choice between two plans. The HSC survey shows that 64 percent of families who are offered employer-sponsored insurance have a choice of plans.
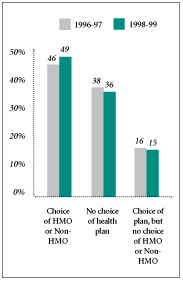
Defining choice may not be as simple as counting how many plans are available to a family. Choice may be too narrow if the family only has a choice between two plans that use gatekeepers and restrict enrollees to in-network providers. In fact, many of the patient protection bills under debate at state and national levels seek to ensure that consumers can maintain ongoing relationships with providers and have adequate access to specialists. Thus, policy makers interested in promoting choice of plans may also want to ensure that families have sufficient breadth of choice. According to HSC 1998-1999 data, 49 percent of families who are offered employer-sponsored health insurance can choose between a health maintenance organization (HMO) and plans with fewer restrictions (see Figure 1).
Figure 1
|
Variations in Plan Offerings
![]() here are variations in plan
offerings to families and employees, depending, in part, on where the family lives and
whether an employee works for a small or large firm.
here are variations in plan
offerings to families and employees, depending, in part, on where the family lives and
whether an employee works for a small or large firm.
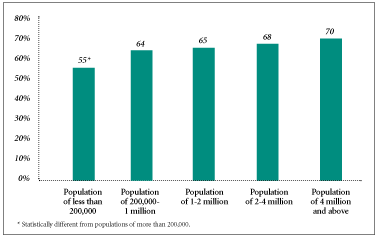
By Community. Not all areas have sufficient population to support a large number of competing health plans. Only about 55 percent of families living in nonmetropolitan and small metropolitan areas who are offered employer-based health coverage have a choice of two or more health plans, compared with 70 percent in large metropolitan areas (see Figure 2).
Variations across markets also stem from differences in the types of industry that predominate and the demand for highly skilled workers. Government employees are more likely to have a choice of plan, so their presence in markets also contributes to variations. More than 70 percent of families in Seattle and Boston have a choice of plan; in contrast, slightly more than 60 percent of families in Little Rock and Greenville have a choice of health plans (see Figure 3). Differences across markets are even larger if family choice between an HMO and a less restrictive health plan is taken into account.
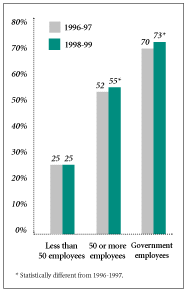
By Firm Size. Employees in firms of 50 or more workers are about twice as likely to have a choice of health plan as those in firms of fewer than 50 workers.4 Government employees are almost three times as likely to have a choice of health plan as employees of small firms.
Providing choice is more difficult for smaller firms than for larger ones. Smaller employers do not have the purchasing power of larger employers, and, by offering choice, the small employer may further erode its purchasing power. In addition, the administrative costs of offering choice, most of which are fixed, are much higher for small firms. Furthermore, insurers typically require smaller firms to contract with only one insurer to prevent adverse selection, so choice is often limited to the product offerings of a single insurer.
Figure 2
|
Figure 3
Health Plan Choice for Families
| ANY CHOICE OF HEALTH PLAN | CHOICE OF HMO OR NON-HMO | |
| Boston, Mass. | 72% | 58% |
| Cleveland, Ohio | 64 | 53 |
| Greenville, S.C. | 62 | 44 |
| Indianapolis, Ind. | 67 | 52 |
| Lansing, Mich. | 70 | 58 |
| Little Rock, Ark. | 61 | 47 |
| Miami, Fla. | 63 | 50 |
| Northern New Jersey | 63 | 51 |
| Orange County, Calif. | 70 | 61 |
| Phoenix, Ariz. | 66 | 54 |
| Seattle, Wash. | 71 | 59 |
| Syracuse, N.Y. | 70 | 55 |
| Average for metroolitan areas with over 200,000 population | 64 | 48 |
Sample includes persons who are offered and are eligible for coverage
through their own employer or their spouse’s employer. HSC Community Tracking Study
Household Survey, 1998-1999
Trends in Plan Choice
![]() olicy makers have expressed concerns that
the number of people with choice of health plans is decreasing over time. Although the
number of indemnity plans offered has fallen steadily since the 1980s, preferred provider
organizations (PPOs) and point-of-service (POS) options have been gaining in popularity.
Recent data from the second round of HSC’s Household Survey show a moderate gain of two
percentage points during the past two years in the proportion of families who are offered
employer-sponsored insurance and who have a choice of plans.
olicy makers have expressed concerns that
the number of people with choice of health plans is decreasing over time. Although the
number of indemnity plans offered has fallen steadily since the 1980s, preferred provider
organizations (PPOs) and point-of-service (POS) options have been gaining in popularity.
Recent data from the second round of HSC’s Household Survey show a moderate gain of two
percentage points during the past two years in the proportion of families who are offered
employer-sponsored insurance and who have a choice of plans.
Small metropolitan areas have experienced the largest increase in plan choice-six percentage points. In contrast, there has been little or no change in areas with moderate to large populations.
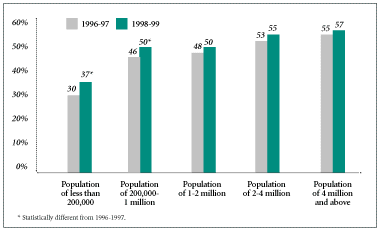
A larger percentage of families in small metropolitan areas have also experienced gains in their breadth of choice. Only 30 percent of families who were offered employer-sponsored insurance and lived in areas with populations under 200,000 had a choice between an HMO and other health plans two years ago, compared with 37 percent today (see Figure 4). A gain of four percentage points was experienced in metropolitan areas with populations between 200,000 and 1 million.
While small metropolitan areas saw a gain in plan choice, comparable gains were not found for employees of small firms (see Figure 5). Obstacles that small firms face in providing a choice of health plans persist. In contrast, the proportion of government employees and workers in large firms who are offered a choice of health plans grew three percentage points during the last two years.
Figure 4
|
Figure 5
|
Policy Implications
![]() lthough more consumers have choice than
is typically assumed, it is unlikely that they have sufficient choice to make health plans
responsive to their concerns. HSC’s findings also show important disparities in choice. In
particular, families in rural and small metropolitan areas, and employees in small firms
are less likely to have a choice of plans. Policy makers concur that plans should be
responsive to consumer concerns, but are divided on how to address this issue.
lthough more consumers have choice than
is typically assumed, it is unlikely that they have sufficient choice to make health plans
responsive to their concerns. HSC’s findings also show important disparities in choice. In
particular, families in rural and small metropolitan areas, and employees in small firms
are less likely to have a choice of plans. Policy makers concur that plans should be
responsive to consumer concerns, but are divided on how to address this issue.
Doubtful that market forces can operate for consumers without plan choice, some policy makers have turned to regulations that directly provide the protections of plan choice and that make plans more accountable to consumers. For example, the ability to sue a health plan is viewed as an important avenue of redress for those who do not have a choice of health plans. Similarly, plan choice can help consumers maintain ongoing relationships with their providers, but open-access mandates may help consumers without plan choice.
Other policy makers seek market remedies to bolster plan choice by facilitating small firms’ efforts to expand their health plan offerings. Some proposals would create local, not-for-profit purchasing cooperatives-health marts-that would offer group health insurance to individuals and small businesses. Another proposal would allow individuals to buy into the Federal Employee Health Benefits Program, the health insurance program for federal workers. These proposals are also favored as mechanisms to help small firms offer health insurance and, thereby, reduce the number of uninsured. A third proposal would mandate plan choice, although some have warned that this may lead many employers to stop offering health insurance altogether.
It is unlikely that consumers will have a voice in the transformation of the health care system without some policy intervention, whether through patient protections or market remedies that ensure plan choice.
Notes
1. Gawande, Atul A., et al., "Does Dissatisfaction with Health Plans Stem from Having No Choices?" Health Affairs, Vol. 17, No. 3 (September/October 1998); Davis, Karen, et al., "Choice Matters: Enrollees Views of their Health Plans," Health Affairs, Vol. 14, No. 2 (Summer 1995).
2. Based on the 1997 Robert Wood Johnson Foundation Employer Health Insurance Survey, 42 percent of employees are offered a choice of health plans. Estimates derived from surveys of employers tend to be consistently lower than surveys of consumers. Estimates from employer surveys also show that about 18 percent of firms offer insurance. Because larger firms are more likely to offer a choice of health plans, this estimate translates into 42 percent of employees who are offered health insurance have a choice of plans.
3. The HSC survey did not identify instances where spouses worked for the same employer or were offered the same plan by different employers.
4. Although estimating plan choice available to a family is preferable to estimating plan choice for an employee, firm size cannot be readily attributed to a family. For these analyses, measures of plan choice are based on the choice of each employee who was offered employer-sponsored insurance and the size of the firm where the employee works.
Data Sources
![]() his Issue Brief presents findings from
surveys that are part of HSC’s Community Tracking Study. The Household Survey, conducted
in 1996-1997 and in 1998-1999, is a nationally representative telephone survey of the
civilian, non- institutionalized population. Data were supplemented by in-person
interviews of households without telephones to ensure proper representation. The survey
contains observations on nearly 33,000 families and 60,000 individuals. The overall
response rate was 65 percent for families.
his Issue Brief presents findings from
surveys that are part of HSC’s Community Tracking Study. The Household Survey, conducted
in 1996-1997 and in 1998-1999, is a nationally representative telephone survey of the
civilian, non- institutionalized population. Data were supplemented by in-person
interviews of households without telephones to ensure proper representation. The survey
contains observations on nearly 33,000 families and 60,000 individuals. The overall
response rate was 65 percent for families.
The 1997 Robert Wood Johnson Foundation Employer Health Insurance Survey is a nationally representative telephone survey of private and public employers. It is based on the responses of 21,545 employers, for an overall response rate of 60 percent.
ISSUE BRIEFS are published by Health System Change.
President: Paul B. Ginsburg
Director of Public Affairs: Ann C. Greiner
Editor: The Stein Group


