Tracking Health Care Costs:
Long-Predicted Upturn Appears
Issue Brief No. 23
November 1999
Paul B. Ginsburg
![]() fter three years of anticipation, health care cost trends have taken an upward turn.
In employment-based insurance, premium increases for 1999 were in the 5 percent range,
up from 3 percent for 1998. The rate of increase in underlying costs of private
insurance-lagged by one year-also rose by approximately 2 percentage points. Many
had expected a sharper upturn in premium increases than underlying cost increases.
This would have heralded a turn in the insurance underwriting cycle, which has not
yet occurred. This Issue Brief tracks the rate of growth of health care costs and
the experience with premiums for employment-based health insurance
and discusses the impact of these trends on consumers.
fter three years of anticipation, health care cost trends have taken an upward turn.
In employment-based insurance, premium increases for 1999 were in the 5 percent range,
up from 3 percent for 1998. The rate of increase in underlying costs of private
insurance-lagged by one year-also rose by approximately 2 percentage points. Many
had expected a sharper upturn in premium increases than underlying cost increases.
This would have heralded a turn in the insurance underwriting cycle, which has not
yet occurred. This Issue Brief tracks the rate of growth of health care costs and
the experience with premiums for employment-based health insurance
and discusses the impact of these trends on consumers.
Cost Trends in Perspective
![]() remium increases for employer-based health insurance
are on the rise, and while these increases reached the 5 percent range for 1999, that is nowhere near
the double-digit increases
of the 1980s and early 1990s. Tracking premium increases is important because
they can affect employer decisions about offering insurance, the type of plan offered and employees’
share of the premium, as well as employees’ ability to afford an employer-sponsored plan.
remium increases for employer-based health insurance
are on the rise, and while these increases reached the 5 percent range for 1999, that is nowhere near
the double-digit increases
of the 1980s and early 1990s. Tracking premium increases is important because
they can affect employer decisions about offering insurance, the type of plan offered and employees’
share of the premium, as well as employees’ ability to afford an employer-sponsored plan.
To understand employer-based premium trends and predict where they may be headed, it is necessary to examine what drives them - underlying health care costs. In 1998, the rate of growth in underlying costs for private insurance increased by about 2 percentage points.
Overall, last year’s rate of growth in national health expenditures - which include Medicare and other public programs as well - increased less rapidly than did the costs underlying private insurance. Medicare’s role in this is significant. The program experienced an extremely low rate of increase in spending in 1998, due to budget cuts, success in controlling fraud and abuse and other factors. As a result, overall health spending trends increased only slightly in 1998. However, the overall rate of increase in spending for 1998 was higher than the growth in gross domestic product (GDP)-a sign that this unusual period, when expenditures grew more slowly than GDP, may be ending.
Health Expenditure Trends
![]() ealth care expenditures can be measured in a
number of different ways: through data on what insurers and patients are paying for care; data on
revenues received by providers of care; or data on costs incurred by providers of care, with
labor costs the most important component. This Issue Brief makes the greatest use of data on
provider revenues and labor costs incurred by health care establishments
(see Data Sources below).
ealth care expenditures can be measured in a
number of different ways: through data on what insurers and patients are paying for care; data on
revenues received by providers of care; or data on costs incurred by providers of care, with
labor costs the most important component. This Issue Brief makes the greatest use of data on
provider revenues and labor costs incurred by health care establishments
(see Data Sources below).
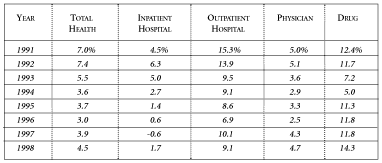
Provider revenues per capita increased from 3.9 percent in 1997 to 4.5 percent in 1998, according to the expanded Milliman & Robertson Health Cost Index (see Figure 1). However, since general inflation was lower in 1998 than in 1997 (1.0 percent and 1.9 percent, respectively1), the increase in spending in real terms is actually more substantial. Even factoring this in, the current rate of growth is far lower than in the 1980s and early 1990s.
Among the major components of provider revenues, the contrast between the high rates of increase for drugs and low rates for inpatient hospital and physician spending is striking. Although increases in drug spending have been in double digits since 1995, the 1998 increase is sharply higher than in 1997. Most of this increase reflects growth in units rather than in price. For example, 1998 drug expenditures increased 14.3 percent while the drug component of the Consumer Price Index increased only 3.7 percent.
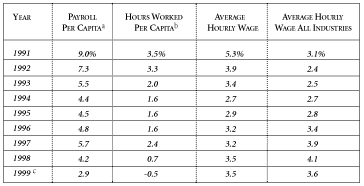
Payrolls in health services establishments on a per capita basis increased 4.2 percent in 1998 and only 2.9 percent for the first eight months of 1999 (see Figure 2). This represents a substantial decline from the 5.7 percent increase in 1997, and this downward trend is in contrast to the continued rise in provider revenues.
The lower growth rate in payroll in 1998 than in 1997 is accounted for entirely by slower growth in hours worked. The increase in the 1998 average hourly wage-3.5 percent was slightly higher than for 1997, but it is still lower than increases in all industries. For many years, wage rates rose much more rapidly in health care than in other industries. This disparity ended in 1994, and now health care workers have a notably lower wage rate growth than other workers.
The sharp decline in the trend of payroll per capita in the first five months of 1999 may indicate that further increases in the rate of growth in health care costs are not likely in the short term. Providers are under a great deal of pressure from Medicare cuts and managed care plans to squeeze their costs.
Figure 1
Annual Change in Per Capita Health
Care Expenditures by Component, 1991-1998

Source: HSC calculations using data from the Milliman & Robertson Health Cost Index database, expanded to include Medicare.
Figure 2
Annual Changes in Employment, Hours and Earnings in Health Services Establishments, 1991-1999

Source: U.S. Department of Labor, Bureau of Labor Statistics, Employment, Hours and Earnings database.
a Product of second and third columns.
b Product of number of production workers (excluding executives and managers) and average hours per week, adjusted for changes in U.S. population.
c Data though August 1999 compared with corresponding months in 1998.
Insurance Premium Trends
![]() his year, like the past few years, anecdotal
data have suggested much higher rates of
premium increase than what was later revealed in systematic data. But recently released surveys
do show more of a boost in the rate of increase in premiums than the
previous year. The Kaiser Family Foundation (KFF)/Hospital Research and Educational Trust (HRET)
Survey of Employer-Based Health Plans (formerly the KPMG Peat Marwick Survey of Employer-Sponsored
Health Benefits) shows that premiums in
1999 increased by 4.8 percent, up from
3.3 percent in 1998.2
his year, like the past few years, anecdotal
data have suggested much higher rates of
premium increase than what was later revealed in systematic data. But recently released surveys
do show more of a boost in the rate of increase in premiums than the
previous year. The Kaiser Family Foundation (KFF)/Hospital Research and Educational Trust (HRET)
Survey of Employer-Based Health Plans (formerly the KPMG Peat Marwick Survey of Employer-Sponsored
Health Benefits) shows that premiums in
1999 increased by 4.8 percent, up from
3.3 percent in 1998.2
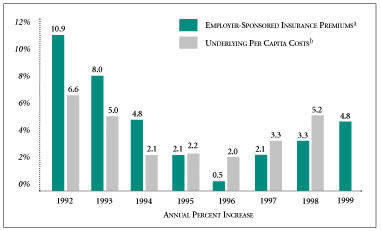
Data from the Hay Benefits Report also show a similar increase, with estimates of a 5.4 percent increase in 1999, up from 3.9 percent in 1998.3 This increase of 1.5 percentage points in the rate of growth of premiums is comparable to the increase in underlying cost trends lagged by one year (5.2 percent in 1998 compared to 3.3 percent in 1997) estimated by Milliman & Robertson (see Figure 3).
Many health policy analysts have been expecting premium trends to increase more sharply than trends in underlying costs as a result of the health insurance underwriting cycle. In contrast to the mid-1990s, when insurers were cutting premiums to enter new markets and gain market share, 1998 and 1999 have been characterized by insurers withdrawing from selected markets.4
For the time being, intense employer resistance to premium increases may have delayed or muted the onset of the next phase of the underwriting cycle, when premiums increase more rapidly than underlying costs. Ultimately this next phase will happen, restoring profitability for plans and attracting new capital into the industry, at which point premium increases will slow relative to underlying cost increases.
One result from the KFF/HRET survey -a large disparity between premium increases for fully and self-insured plans-suggests that the shift in the underwriting cycle may be starting. The premium increase for fully insured plans for 1999 was 5.8 percent, compared to a 3.7 percent increase for self-insured plans. This implies that fully insured plans raised premiums more aggressively than actuaries expected for cost increases, which is reflected in the rates for self-insured plans.
Figure 3 shows this pattern during the 1990s. From 1992 through 1994, premium increases exceeded underlying cost increases by a substantial margin, and health plans were very profitable. This trend reversed in 1995. From 1996 through 1998, premium increases lagged underlying cost increases, and health plans’ profit margins fell considerably. If underlying cost trends in 1999 turn out to be similar to those in 1998, that will mark a substantial reduction in the excess of cost increases over premium increases. Premium increases might then exceed cost increases in 2000.
Over time, premium increases have been diverging among different types of health plans. In both the KFF/HRET and Hay surveys, indemnity plans had the highest increase-almost 3 percentage points higher than health maintenance organizations (HMOs) and point-of- service (POS) plans in the Hay survey. This is more in line with expectations than in previous years, when the spread was much smaller and increases for indemnity plans were almost as low as those for managed care plans.
Figure 3
Changes in Employer-Sponsored Insurance Premiums and Underlying Per Capita Costs, 1992-1999

a KFF/HRET Survey of Employer-Based Health Plans (1999) and KPMG Peat Marwick Survey of Employer-Sponsored Health Benefits (1992-1998).
b Milliman & Robertson, Health Cost Index, $0 deductible. In contrast to Figure 1, data are not expanded to include Medicare.
Note: 1999 Health Cost Index not available.
Implications for Consumers
![]() hen premium increases began declining in
the early 1990s, employers did not
immediately pass on those savings to their employees. In fact, employers increased
the proportion of premiums contributed
by employees enrolling in health plans, especially for family coverage.
hen premium increases began declining in
the early 1990s, employers did not
immediately pass on those savings to their employees. In fact, employers increased
the proportion of premiums contributed
by employees enrolling in health plans, especially for family coverage.
Subsequently, premium increases declined even more sharply, and the trend toward higher employee contributions was reversed, giving employees substantial relief from rising health costs. In recent years, both the KFF/HRET and Hay surveys have shown an increase in the share of family premiums paid by employees and a decrease in the share of single premiums paid, perhaps because employers are responding to the growing number of families with dual wage earners and dual coverage.
During this decade, consumers have gotten substantial relief from out-of-pocket spending for medical services. Out-of-pocket spending for medical services was 6 percent lower for the average person in 1997 than in 1990, according to the U.S. Department of Labor’s Consumer Expenditure Survey, in contrast to the 36 percent increase in overall spending for medical services per capita. And while consumer spending for drugs increased 27 percent over the period, this is far lower than the 97 percent increase in drug spending per capita.
The decline in out-of-pocket spending in relation to total spending is due largely to the switch to managed care. Employees enrolled in HMOs, for example, commonly have out-of-pocket costs in the area of $10 per physician visit and $5 per prescription filled, in contrast to a deductible of perhaps $250 per person and coinsurance of 20 percent in indemnity plans. However, some of this financial benefit to consumers comes at the expense of restrictions on choice and other constraints of managed care.
The Future
![]() ver the longer term, the dominant influence
on premium trends is costs, although premiums are likely to rise more rapidly
in 2000 because of the shift in the under-
writing cycle. Several factors argue for an
acceleration in cost increases:
ver the longer term, the dominant influence
on premium trends is costs, although premiums are likely to rise more rapidly
in 2000 because of the shift in the under-
writing cycle. Several factors argue for an
acceleration in cost increases:
- In response to the managed care backlash, plans are becoming less restrictive.
- Managed care regulations at the state and federal level and potential lawsuits against plans
could raise costs.
- Expensive new technologies, especially pharmaceuticals, continue to enter
medical practice.
- Continuing provider consolidation could lead to higher rates for services.
Despite these intense pressures, the large, double-digit increases of the late 1980s and early 1990s are not likely to return. Today’s health care markets are far more competitive than they were in the past, with employers putting pressure on plans to hold down premium increases and plans, in turn, pressing providers for discounts. These pressures will continue to affect the rate at which costs grow.
But continued growth in costs - even if the magnitude of the increase is less than historical rates - will have implications for the economy as a whole, state and federal budgets and the uninsured. Substantial premium increases mean that consumers have less to spend on other goods and services. Increased growth in spending for Medicare and Medicaid would mar the rosy fiscal picture that governments currently enjoy. Finally, increases in health care costs could lead to an increasing number of uninsured. A recent HSC study shows that 20 percent of the uninsured have access to employer-sponsored coverage but have declined that coverage, mostly due to costs. A substantial uptick in costs could further erode the ability of workers to afford health insurance.
Data Sources
![]() he 1999 KFF/HRET survey includes 1,939 employers and
is a random sample of firms.
The 1999 Hay Benefits Report includes 1,009 employers and
is a convenience sample drawn from its client base.
he 1999 KFF/HRET survey includes 1,939 employers and
is a random sample of firms.
The 1999 Hay Benefits Report includes 1,009 employers and
is a convenience sample drawn from its client base.
The Milliman & Robertson Health Cost Index (HCI) is designed to reflect cost increases faced by private insurers. It is limited to health services that tend to be insured - inpatient and outpatient hospital services, physician services and prescription drugs. Since provider revenue data tend to cover all patients, M&R analysts subtract data on Medicare payments to providers.
The HCI tracks the experience of a private policy with a $250 deductible. The data in Figure 1 differ from the HCI by reflecting a $0 deductible and incorporating spending for Medicare. The data in Figure 3 do not incorporate Medicare but do reflect a $0 deductible.
Data on payroll costs in health services establishments compiled by the Bureau of Labor Statistics include all nonsuper-visory workers in health services establishments (SIC 8000). Nonsalaried health professionals are not included. Although only one component of provider costs, payrolls comprise an important one and are available with the shortest time lag.
Rates of growth for provider revenues from M&R and payroll costs from the BLS are reported on a per capita basis. This is the most relevant measure for policy makers and is directly comparable to premium trends.
The Department of Labor’s Consumer Expenditure Survey asks a sample of approximately 5,000 households about their spending by category of goods and services over the past quarter. For health services, there are separate questions for health insurance premiums, medical services, drugs and medical supplies.
Notes
1The measure of general inflation is the chain-type GDP index developed for the U.S. Department of Commerce, Bureau of Economic Analysis.
2 Premium increases are calculated as a weighted average of the increases for four plan types: conventional, HMO, PPO and POS. This method is designed to standardize for mix of health plan types. The effects of a shift from types of plans with high premiums to types of plans with low premiums are not reflected in these calculations.
3The estimate from the Hay survey, which differs slightly from the estimate in the Hay public release,was calculated by the author in a manner designed to be most compatible with the estimate from the KFF/HRET survey.
4Insurers have withdrawn selectively from Medicare, Medicaid and private insurance market segments in response to disappointing profitability during this period. Site visits conducted by HSC have reflected these withdrawals and the absence of reports of aggressive entry into markets by outside insurers. The latter was noted extensively in the 1996-1997 site visits.