Uninsurance Rates
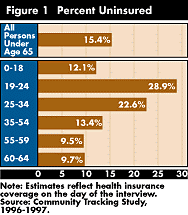
![]() oung adults age 19 to 24 have the highest uninsurance rates (about 29 percent) followed by those age 25 to 34 (about 23 percent) (see Figure 1).2 While these two age groups together account for about one-quarter of the total nonelderly population, they account for about 40 percent of the uninsured population. In contrast, less than 10 percent of near-elderly individuals are uninsured, and even before the recent legislation to expand coverage for children took effect, the uninsurance rate among children was about 12 percent -- the second-lowest among all age groups.
oung adults age 19 to 24 have the highest uninsurance rates (about 29 percent) followed by those age 25 to 34 (about 23 percent) (see Figure 1).2 While these two age groups together account for about one-quarter of the total nonelderly population, they account for about 40 percent of the uninsured population. In contrast, less than 10 percent of near-elderly individuals are uninsured, and even before the recent legislation to expand coverage for children took effect, the uninsurance rate among children was about 12 percent -- the second-lowest among all age groups.
The sharp increase in uninsurance rates after age 18 reflects several factors:
- loss of eligibility for Medicaid coverage;
- loss of eligibility under parents’ private insurance coverage;
- lower labor force participation;
- working at jobs where health benefits are not offered or for which they are not eligible; and
- lower take-up rates of health insurance coverage, when offered by employers.
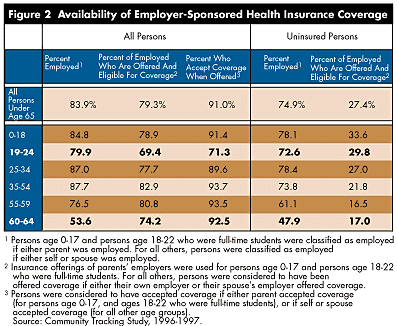
The decreasing rates of uninsurance after age 34 suggest that many young adults will eventually move up into situations where health benefits are offered by employers (or a spouse’s employer), and they are more likely to accept coverage because their incomes and the expected benefits of health insurance are higher. Labor force participation and the percent of employed persons who are offered and eligible for coverage increases after age 24, and then begins to decline when people are in their the mid- to late-50s (see Figure 2).3, 4 Acceptance rates of employer-sponsored coverage when offered is 90 percent or above for all age groups, except for the 19 to 24 age group where the acceptance rate is 71 percent. Even though older adults age 60 to 64 are less likely on average to be employed or offered health insurance through a current employer, many have health insurance through retiree health plans or have purchased individual coverage on their own.5

While older adults have relatively low rates of uninsurance, those who are uninsured may have the most difficulty obtaining insurance coverage as they approach the age of Medicare eligibility. Fewer than half of uninsured persons age 60 to 64 are employed or have an employed spouse, compared with about three-quarters of all other uninsured persons up to age 55. Furthermore, the percent of uninsured persons who are offered employer-sponsored coverage decreases with age so that only 17 percent of employed, uninsured older adults are offered coverage, compared with about 30 percent of uninsured young adults and more than one-third of uninsured children. Taking labor force participation and employer-offer rates into account, less than 10 percent of uninsured older adults have access to employer-sponsored coverage through a current employer, compared with more than 20 percent of uninsured young adults and more than one-quarter of uninsured children.

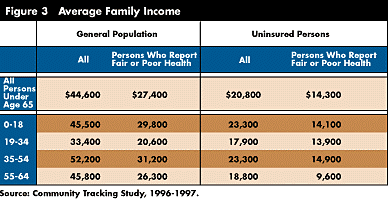
Uninsured older adults are also not in a good position financially to purchase health insurance coverage on their own. The average income of uninsured persons in the 55 to 64 age group is less than half that of all near-elderly (see Figure 3).6 Average income for uninsured persons is even lower for those who reported their health to be fair or poor, and uninsured 55- to 64-year-olds in fair or poor health have the lowest income of any uninsured age group -- about $9,600. Since older adults generally are higher health risks, the costs of purchasing coverage will be significantly greater for them than for other age groups.
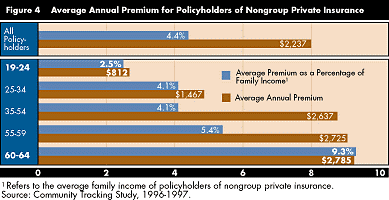
Indeed, among those who purchased individual or nongroup health coverage (in which premiums are rated according to the individual’s health risk rather than by the group, which may include persons of all ages), older adults typically spent a considerably higher proportion of their income on premiums -- about 9 percent for the 60- to 64-year-old group -- than other adult age groups (see Figure 4). The fact that uninsured older adults tend to be in worse health and have lower incomes than older adults who purchase individual insurance suggests they would incur even higher financial burdens by purchasing this type of coverage.

The very low incomes for uninsured older adults also suggest that few will be able to afford buying-in to Medicare as called for in the President’s proposal. The plan would allow persons age 62 to 64 to buy-in to Medicare for about $300 per month. Other provisions would allow displaced workers in the 55 to 62 age group to buy-in to Medicare for about $400 per month, and would extend coverage under the Comprehensive Omnibus Budget Reconciliation Act of 1985 (COBRA) for persons age 55 to 65 whose employers withdrew previously offered retiree health benefits.
Based on estimates of family income from the Community Tracking Study, the average uninsured near-elderly person would have to spend more than 20 percent of his or her income to buy-in to the first part of the proposal, and about 25 percent under the second part of the proposal.77 For uninsured near-elderly who reported fair or poor health, the financial burden would be even higher -- one-third to one-half of their income on average would be spent on premiums. Thus, the financial barriers to obtaining buy-in coverage may be prohibitive to those who need it most.
The financial burdens incurred by the uninsured near-elderly would also be much higher than what individuals typically incur for purchasing individual coverage or employer-sponsored health insurance, largely because of the higher incomes of privately insured persons and the much lower premiums typically paid by enrollees in employer-sponsored insurance.88 Because of the high expense, even the Clinton administration estimates that only about 300,000 individuals -- approximately 15 percent of the uninsured population in the 55 to 64 age group according to Center data -- would take advantage of the buy-in options.
These findings also suggest that increasing the age of full Medicare eligibility from 65 to 67 would likely increase the number of uninsured older adults. (Although passed by the Senate, this change was ultimately defeated in 1997’s budget agreement.) It is likely that the economic and health circumstances that prevent uninsured older adults from obtaining coverage would only be worse for those age 65 and 66. While many if not most 65- and 66-year-olds would be able to obtain health insurance elsewhere -- whether through retiree benefits, postponing retirement to continue coverage under their employer or purchasing individual coverage directly -- it is likely that some would either lose coverage or continue to be uninsured. As with the near-elderly, allowing a Medicare buy-in for 65- and 66-year-olds would probably get few takers without significant subsidies.
