
Physician Incomes in Rural and Urban America
Issue Brief No. 92
January 2005
James D. Reschovsky, Andrea Staiti
Amid concerns that too few physicians practice in many rural areas, lower income potential is cited as one obstacle to attracting and retaining rural physicians. Congress has responded by increasing Medicare payment rates to virtually all physicians practicing in rural areas. However, average physician incomes in rural and urban areas do not differ significantly, even after accounting for differences in physician work effort, specialty, and other physician and practice characteristics, according to a new national study by the Center for Studying Health System Change (HSC). Moreover, after accounting for the local cost of living, rural physician incomes on average provide about 13 percent more purchasing power than urban physician incomes.
- Too Few Rural Physicians or Too Many Urban Physicians?
- Recent Medicare Law Benefits Almost All Rural Physicians
- Physician Incomes
- Income Differs by Specialty
- Other Factors Affect Incomes
- Policy Implications
- Notes
- Data Source
Too Few Rural Physicians or Too Many Urban Physicians?
![]() ural areas have fewer physicians per capita—particularly specialists—than
urban areas, prompting persistent concerns about inadequate access to medical
care in many rural areas. To illustrate, on average, rural residents have 53
primary care physicians (PCPs)—internists, family/general practitioners
and pediatricians—per 100,000 people compared with 78 PCPs per 100,000
urban residents. For specialists, the supply is 54 vs. 134 per 100,000 people,
respectively.1
ural areas have fewer physicians per capita—particularly specialists—than
urban areas, prompting persistent concerns about inadequate access to medical
care in many rural areas. To illustrate, on average, rural residents have 53
primary care physicians (PCPs)—internists, family/general practitioners
and pediatricians—per 100,000 people compared with 78 PCPs per 100,000
urban residents. For specialists, the supply is 54 vs. 134 per 100,000 people,
respectively.1
This disparity in physician supply, however, does not necessarily mean that rural areas overall lack enough physicians. Instead, it may reflect an oversupply of physicians in urban areas or the use of urban physicians—particularly specialists—by rural residents.
Other research suggests that across the full population, access to care in rural areas is on par with and, perhaps, slightly better than in urban areas except for access to mental health services.2 For instance, 6 percent of rural patients reported unmet health needs during the prior year, compared with 7 percent of urban patients. To the extent rural residents receive less medical care relative to urban residents, it likely stems from demand-side reasons—lower patient income and lower rates of insurance coverage—rather than lower physician supply.
Although research has shown only small differences in urban and rural physician incomes, advocates often cite lower physician incomes in rural areas as an obstacle to recruiting and retaining physicians. Other obstacles include less control over work hours, professional isolation, fewer spousal job opportunities and a lack of amenities associated with urban areas.3
Back to Top
Recent Medicare Law Benefits Almost All Rural Physicians
The Medicare Modernization Act of 2003 (MMA) included two provisions to boost Medicare payment rates to physicians practicing in rural areas. The first enhanced the Medicare Incentive Program between 2005 and 2007, which provides bonus payments for physicians practicing in designated, mostly rural, physician-scarcity areas. The other legislative change established a floor for the geographic adjustment to the work component of the Medicare physician fee schedule between 2004 and 2006, which effectively increased payments to nearly all rural physicians. Although temporary, the estimated cost of both provisions is $1.7 billion. The MMA changes were in addition to existing programs encouraging physicians to practice in underserved areas, many of which are rural.4
The main question for federal policy makers is whether rural physician incomes are sufficiently high to attract and retain enough physicians to provide the population with adequate access to medical care—especially in the case of Medicare. Yet, simple comparisons of average incomes among urban and rural physicians can be misleading because specialty composition, work effort and local price levels differ across urban and rural areas.
Back to Top
Physician Incomes
As part of the 2000-01 HSC Community Tracking Study Physician Survey, physicians were asked to report net income from their medical practice during 1999 (see Data Source). Reported physician incomes were inflated to 2003 levels, using a compensation growth rate for all physicians derived from the Medical Group Management Association Physician Compensation and Production Survey.5 Because concerns about access to care are often focused on more remote rural areas, rural physicians were divided into two groups: those practicing in rural counties adjacent to metropolitan areas and those practicing in rural counties nonadjacent to metropolitan areas.6
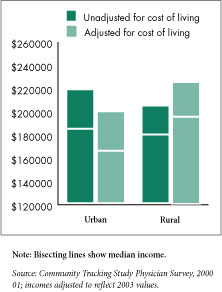
Average annual physician incomes are somewhat lower in rural areas than in urban areas—$204,000 vs. $218,000—although the difference is not statistically significant (see Figure 1). Moreover, average physician incomes differed little between rural counties adjacent and nonadjacent to metropolitan areas—$201,000 vs. $212,000. Likewise, median physician incomes, though lower, varied little across geographic areas, ranging from $179,000 in rural areas to $184,000 in urban areas.7
A different picture emerges when one looks at physicians’ “real” compensation, or the purchasing power of their incomes after accounting for differences in the cost of living, which varies considerably across the nation and generally is lower in rural areas. To create a measure of real compensation, physician incomes were adjusted by a local cost-of-living index.8
Because the cost of living is lower in rural areas, rural physicians have significantly more purchasing power—or higher “real” incomes—after accounting for the lower cost of living. The average income of rural physicians adjusted for the cost of living was significantly higher than urban physicians’—$225,000 vs. $199,000. This translates into rural physician incomes providing about 13 percent more purchasing power than urban physician incomes.
The average income of physicians in nonadjacent rural counties was highest—$242,000—while those in rural counties adjacent to metropolitan areas averaged $217,000, although the difference between adjacent/nonadjacent counties was not statistically significant.
Figure 1 |
 |
Back to Top
Income Differs by Specialty
Nationally, physician income differs by specialty, with specialists earning more than primary care physicians. Proportionally, more rural physicians are primary care providers, comprising 54 percent of the rural physician workforce compared with 38 percent in urban areas. If the specialty distribution in rural areas mirrored that of urban areas, average rural physician incomes without and with adjustment for the cost of living would rise to $212,000 and $232,000, respectively.
Before adjusting for the cost of living, rural primary care physicians have an income advantage over their urban counterparts, while rural specialist incomes are lower (see Table 1). Though differences are not statistically significant, rural PCPs’ earnings are 6 percent greater than urban PCPs while rural specialist incomes are about 3 percent lower. After cost-of-living adjustments, differences were significant with rural PCP “real” incomes averaging about 30 percent more than urban PCPs ($189,000 vs. $145,000), while rural specialists hold a 15 percent real income advantage ($266,000 vs. $232,000). In rural counties nonadjacent to metropolitan areas, average real incomes were 40 percent and 28 percent greater than urban areas for PCPs and specialists, respectively.
Back to Top
Table 1
|
||||||
|
Urban
|
All Rural
|
Rural Counties Adjacent to Metro Area
|
Rural Counties Nonadjacent to Metro Area
|
|||
| Unadjusted (Nominal) Income | ||||||
| All Physicians | $218,000 | $204,000 | $201,000a | $212,000 | ||
| All Primary Care Physicians | 161,000 | 170,000 | 166,000 | 177,000b | ||
| General Internal Medicine | 169,000 | 175,000 | 170,000 | 183,000c | ||
| Family/General Practice | 156,000 | 171,000 | 169,000 | 176,000 | ||
| General Pediatrics | 156,000 | 152,000 | 143,000b | 176,000c,d | ||
| All Specialists | 253,000 | 245,000 | 238,000 | 263,000 | ||
| Medical Specialists | 226,000 | 208,000b | 205,000b | 214,000 | ||
| Surgical Specialists | 291,000 | 283,000 | 271,000b | 318,000c | ||
| (Real) Income Adjusted by Cost of Living | ||||||
| All Physicians | 199,000 | 225,000b | 217,000a | 242,000b | ||
| All Primary Care Physicians | 145,000 | 189,000a | 182,000a | 203,000a,d | ||
| General Internal Medicine | 149,000 | 192,000a | 183,000a | 206,000a,c,d | ||
| Family/General Practice | 146,000 | 193,000a | 188,000a | 203,000a | ||
| General Pediatrics | 138,000 | 165,000a | 153,000b | 196,000a,c,d | ||
| All Specialists | 232,000 | 266,000a | 254,000b | 298,000b,d | ||
| Medical Specialists | 207,000 | 223,000 | 220,000 | 232,000 | ||
| Surgical Specialists | 268,000 | 310,000 | 288,000 | 372,000b,c | ||
| a Difference with mean for
urban physicians significant at p <0.05. b Difference with mean for urban physicians significant at p <0.10. c Less than 50 unweighted observations in cell. d Mean in adjacent and nonadjacent rural counties is significantly different at p <0.10. Source: HSC Community Tracking Study Physician Survey, 2000-01; incomes adjusted to reflect 2003 values. |
||||||
Other Factors Affect Incomes
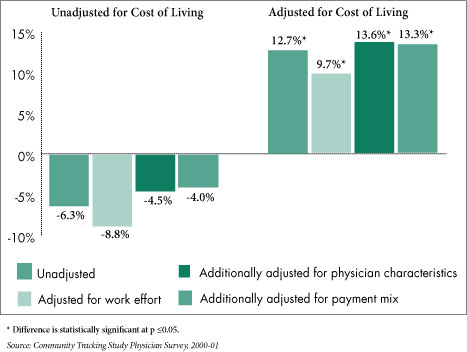
Simple comparisons of average physician income may not provide an accurate picture of whether rural physicians are compensated better or worse than their urban counterparts. First, rural physicians typically work somewhat longer hours—on average, about 4 percent, or two hours, more a week—than urban physicians.9 Indeed, among rural primary care physicians the difference is greatest, they work about 10 percent, or five hours, more a week than urban primary care physicians.
Second, specialty mix affects urban-rural physician income comparisons. Other differences in urban-rural physician populations, such as average years in practice, also could affect comparisons.10 Finally, rural patients are far more likely to be covered by Medicaid or Medicare, public programs that typically pay less than private insurers. Rural physician practices receive 56 percent of their revenue from Medicare and Medicaid compared with 45 percent for urban practices. The higher proportion of Medicare patients in rural areas is often used to justify higher Medicare payment rates for rural physicians.
None of these factors, however, affects rural physician incomes to a great degree (see Figure 2). Adjusting for physician time spent working lowers rural physician incomes relative to urban incomes by 2 to 3 percentage points, while further adjusting physician characteristics such as specialty and years in practice increases rural incomes relative to urban incomes by roughly 4 percentage points. Finally, adjusting for source of practice revenue has virtually no effect and may reflect the fact that many rural physicians are able to command higher payment rates from private insurers because they have little competition in their local markets.11
Back to Top
Figure 2
|
 |
Back to Top
Policy Implications
Simple comparisons of average physician incomes in rural and urban areas indicate that rural physicians generate roughly equivalent incomes from their medical practices as urban physicians. However, rural physicians’ incomes provide significantly greater purchasing power when adjusted for differences in the cost of living in rural and urban areas—even after controlling for differences in physician and practice characteristics, work effort and sources of practice revenue.
Higher “real” earnings for rural physicians may be a natural market response to compensate physicians for the disadvantages of rural practice. This may explain why rural physicians in more remote counties command higher average incomes than rural physicians practicing closer to metropolitan areas, even before accounting for cost-of-living differences.
More central to the question of whether rural physician incomes are too high or not high enough is whether compensation levels are sufficient to generate a supply of physicians necessary to provide rural populations with good access to medical care. The large difference in the number of physicians between urban and rural areas does not imply that rural areas have too few providers. Other research suggests, with the exception of mental health care, that rural areas overall have an adequate number of physicians to provide access to care roughly equivalent and perhaps superior to urban areas.13 Instead, targeted interventions aimed at specific rural areas with documented physician shortages, such as the other, less expensive MMA provision bolstering the Medicare Incentive Program, may be a more efficient way to deal with localized access problems.
Back to Top
Notes
| 1. | Reschovsky, James D. and Andrea B. Staiti, “Access and Quality of Medical Care in Urban and Rural Areas: Does Rural America Lag Behind?” Working Paper, Center for Studying Health System Change, Washington, D.C. (2004). |
| 2. | Reschovsky and Staiti, 2004. |
| 3. | National Rural Health Association, Issue Paper 13, “Physician Recruitment and Retention,” November 1998, Kansas City, Mo., available at www.nrharural.org/dc/issuepapers/ipaper13.html. |
| 4. | Other programs include J-1 visa waivers granted to international medical graduates willing to practice in underserved areas and loan repayment subsidies for those joining the National Health Service Corps. |
| 5. | Medical Group Management Association, 2004 Physician Compensation and Production Survey, based on 2003 data. Inflation factors were based on 1999-2003 increases in median incomes across all specialties. |
| 6. | There was insufficient sample size to isolate physicians practicing in the most remote rural counties, often termed frontier counties, or those with less than seven persons per square mile. Access-to-care problems are thought to be most severe in these areas. |
| 7. | For income comparisons, we excluded those who began practice in the previous year and a small number of physicians who reported no income or extremely high incomes from their medical practice (more than $1 million a year). We also excluded physicians working less than 40 weeks during the previous year. |
| 8. | The index is the ACCRA Cost of Living Index, (www.coli.org). It is based on sample prices of a market basket of goods and services. Data are not collected for all areas, so values were imputed based on a technique developed by W.W. McMahon. See “Geographical Cost of Living Differences: An Update,” Journal of the American Real Estate and Urban Economics Association, Vol. 19, No. 3. To verify the validity of this measure, we also adjusted physician incomes by the hospital wage index produced by the Centers for Medicare and Medicaid Services. Local wage rates closely reflect local price levels for goods and services. The hospital wage index produced results that were very similar to those reported. |
| 9. | Weekly work hours excludes time on call when not treating patients. Many rural physicians are thought to bear a much larger on-call burden than their urban counterparts. |
| 10. | In addition to specialty, we adjusted for years in practice, gender, board certification, and whether the physician works for multiple practices, is a full or part owner of the practice, is trained in osteopathic medicine and is a graduate of an international medical school. |
| 11. | Dyckman, Z., and P. Hess, Survey of Health Plans Concerning Physician Fees and Payment Methodology, 2003. (A study conducted by Dyckman & Associates for the Medicare Payment Advisory Commission No. 03–7.) Available at www.medpac.gov/publications/contractor_reports/Aug03_PhysPaySurvey(cont)Rpt.pdf. |
| 12. | Reschovsky and Staiti, 2004. |
| 13. | For instance, Reschovsky and Staiti, 2004, report that 73 percent of rural physicians accept all new Medicare patients, as compared with 66 percent of urban physicians. See also Keith J. Mueller, et al., “Rural Physicians’ Acceptance of New Medicare Patients” Rural Policy Brief, Vol. 9, No. 5, Rural Policy Research Institute, Center for Rural Health Policy Analysis, Omaha, Neb. (August 2004). |
Back to Top
Data Source
This Issue Brief presents findings from the 2000-01 HSC Community Tracking Study Physician Survey, a nationally representative telephone survey of physicians involved in direct patient care in the continental United States. The sample of physicians was drawn from the American Medical Association and the American Osteopathic Association master files and included active, nonfederal, office- and hospital-based physicians who spent at least 20 hours a week in direct patient care. Residents and fellows were excluded. The survey contains information on about 12,000 physicians and the response rate was 59 percent. The sample includes 11,277 physicians practicing in urban areas, 790 in rural counties adjacent to metropolitan areas and 339 in nonadjacent rural counties.
Back to Top
ISSUE BRIEFS are published by the
Center for Studying Health System Change.
600 Maryland Avenue, SW, Suite 550
Washington, DC 20024-2512
Tel: (202) 484-5261
Fax: (202) 484-9258
www.hschange.org
Vice President: Len M. Nichols