Uninsurance Rates Vary Widely Across Communities and Regions
Data Bulletin No. 05
Fall 1997
Peter J. Cunningham, Jeremy D. Pickreign
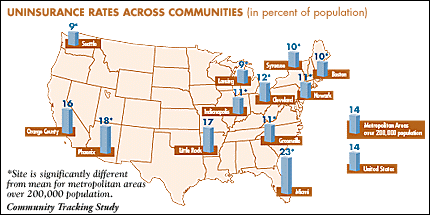
![]() ational estimates of the number of Americans without health insurance have played a central role in discussions of health care among policy makers and the media. What is not as well known is the extent to which uninsurance rates vary across the country. Recent findings from the Community Tracking Study’s Household Survey show that uninsurance rates among 12 randomly selected communities range widely, from a high of 23 percent in Miami to a low of 9 percent in Seattle. In addition, uninsurance rates in 10 of the 12 communities differ significantly from the 14 percent average for all metropolitan areas with more than 200,000 persons.
ational estimates of the number of Americans without health insurance have played a central role in discussions of health care among policy makers and the media. What is not as well known is the extent to which uninsurance rates vary across the country. Recent findings from the Community Tracking Study’s Household Survey show that uninsurance rates among 12 randomly selected communities range widely, from a high of 23 percent in Miami to a low of 9 percent in Seattle. In addition, uninsurance rates in 10 of the 12 communities differ significantly from the 14 percent average for all metropolitan areas with more than 200,000 persons.

REGIONAL VARIATIONS
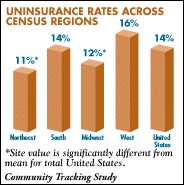
![]() here are also regional variations in uninsurance rates, although they are smaller than the differences among communities. (See bar graph below.) The Center’s survey of a nationally representative sample found that uninsurance rates are lowest in the northeast (11 percent) and midwest (12 percent), and highest in the south (14 percent) and west (16 percent).
here are also regional variations in uninsurance rates, although they are smaller than the differences among communities. (See bar graph below.) The Center’s survey of a nationally representative sample found that uninsurance rates are lowest in the northeast (11 percent) and midwest (12 percent), and highest in the south (14 percent) and west (16 percent).
In two of these four regions, there is also considerable variation among the 12 sampled communities. For example, the uninsurance rates of the three communities in the south range from a low of 11 percent (Greenville, S.C.) to a high of 23 percent (Miami). Similarly, uninsurance rates among the three communities in the west range from a low of 9 percent (Seattle) to a high of 18 percent (Phoenix). The uninsurance rates in the sampled communities in the northeast and midwest regions are more uniform.
COMMUNITY CHARACTERISTICS
![]() revious research has identified some important predictors of whether individuals have health insurance coverage. For example, uninsured persons are more likely to be in families headed by workers in small firms or who are self-employed, and have lower incomes. Hispanics also have much higher uninsurance rates than other ethnic or racial groups. 1, 2
revious research has identified some important predictors of whether individuals have health insurance coverage. For example, uninsured persons are more likely to be in families headed by workers in small firms or who are self-employed, and have lower incomes. Hispanics also have much higher uninsurance rates than other ethnic or racial groups. 1, 2
 Are these same factors associated with uninsurance levels in communities? While it is beyond the scope of this bulletin to explain the differences in uninsurance rates across the 12 sample sites, the three communities with the highest uninsurance rates tend to have higher poverty rates and a much higher percentage of Hispanics than the three communities with the lowest uninsurance rates. Although the community with the highest uninsurance rate (Miami) also had the highest percentage of workers in small firms (fewer than 25 workers) or who are self-employed, the variation across communities on this measure is generally not very large and does not appear to correspond strongly with variation in uninsurance rates.
Other factors may be important in explaining differences in uninsurance rates across communities, including differences in eligibility requirements for Medicaid and other public programs, and labor market characteristics such as industry type and the extent of union membership among the employed population.
| Uninsured | Persons below federal poverty level | Workers in small firms or self-employed | Hispanic | |
| Highest uninsurance rates | ||||
| Miami, Fla. | ||||
| Phoenix, Ariz. | ||||
| Little Rock, Ark. | ||||
| Lowest uninsurance rates | ||||
| Syracuse, N.Y. | ||||
| Lansing, Mich. | ||||
| Seattle, Wash. | ||||
| Metropolitan areas over 200,000 pop. | ||||
| * Site value is significantly different from mean for metropolitan areas over 200,000 population. Community Tracking Study | ||||
IMPLICATIONS FOR CARE OF THE UNINSURED
![]() he variation in uninsurance rates across communities may have significant implications for the delivery of services to the uninsured. Much care for the uninsured -- whether provided by emergency departments, public hospitals, free clinics or charity from private providers -- is financed directly through public subsidies or indirectly by shifting the costs of care for the uninsured to other payers. These resources have become seriously constrained in recent years, and they may be even more constrained in areas with relatively high numbers of uninsured persons.
he variation in uninsurance rates across communities may have significant implications for the delivery of services to the uninsured. Much care for the uninsured -- whether provided by emergency departments, public hospitals, free clinics or charity from private providers -- is financed directly through public subsidies or indirectly by shifting the costs of care for the uninsured to other payers. These resources have become seriously constrained in recent years, and they may be even more constrained in areas with relatively high numbers of uninsured persons.
The Center will continue to track changes in uninsurance rates for the 12 communities represented in the study, and also will investigate the extent to which the relative size of the uninsured population and other market factors affect the health care use and access of uninsured persons.
Notes
1. Employee Benefit Research Institute. 1996. Sources of Health Insurance and Characteristics of the Uninsured: Analysis of the March 1996 Current Population Survey. EBRI Issue Brief Number 179 (November). Washington, DC.
2. Short, P.A., A. Monheit, and K. Beauregard. 1989. A Profile of Uninsured Americans. (DHHS Publication No. [PHS] 89-3443). National Medical Expenditure Survey Research Findings 1, Agency for Health Care Policy and Research. Rockville, MD.
This Data Bulletin presents preliminary findings from the Household Survey, a nationally representative telephone survey of the civilian, non-institutionalized population conducted in 1996 and 1997 as part of the Community Tracking Study. The survey included 43,771 persons in 23,554 families. All comparisons and differences described in the text are statistically significant at the p<0.05 level.