
Mixed Signals: Trends in Americans' Access to Medical Care, 2007-2010
Tracking Report No. 25
August 2011
Ellyn R. Boukus, Peter J. Cunningham
Likely reflecting the severe economic downturn and subsequent decline in demand for health care, the number and proportion of Americans reporting going without or delaying needed medical care declined modestly between 2007 and 2010, according to findings from the Center for Studying Health System Change’s (HSC) nationally representative 2010 Health Tracking Household Survey. Despite increases in the number of uninsured, slightly more than one in six Americans—52 million people—reported not getting or delaying needed medical care in 2010, down from one in five—58.6 million people—in 2007. The decline was driven primarily by fewer access problems for insured people, likely reflecting recession-related decreases in the demand for medical care. Nevertheless, the access gap between insured and uninsured people widened in 2010 compared to 2007, especially for lower-income people and those with health problems. Among people reporting problems getting medical care, the cost of care was an even bigger concern than in previous years. Fewer people encountered health system-related barriers, such as getting timely appointments with doctors, possibly reflecting freed-up health system capacity because of lower demand.
- Fewer Access Problems, More Uninsured
- Declining Unmet Needs, Decreasing Demand
- Lower-Income and Sicker People Face More Access Problems
- Children’s Access Stable
- Cost Concerns Rise, System Barriers Down
- Implications
- Notes
- Data Source and Funding Acknowledgement
- Supplementary Tables
Fewer Access Problems, More Uninsured
![]() he number and proportion of uninsured Americans increased sharply between 2007 and 2010—from 42.8 million in 2007 to 51.7 million in 2010—as the recession led to declines in employer-based health insurance.1 Such a large increase in the uninsured population usually would be accompanied by an overall decrease in access to care among Americans, given the higher incidence of access problems among the uninsured relative to the insured. Nevertheless, in 2010, approximately 17 percent of the U.S. population—about one in six people—reported not getting or delaying needed medical in the previous 12 months, down from 20 percent—one in five—in 2007.
he number and proportion of uninsured Americans increased sharply between 2007 and 2010—from 42.8 million in 2007 to 51.7 million in 2010—as the recession led to declines in employer-based health insurance.1 Such a large increase in the uninsured population usually would be accompanied by an overall decrease in access to care among Americans, given the higher incidence of access problems among the uninsured relative to the insured. Nevertheless, in 2010, approximately 17 percent of the U.S. population—about one in six people—reported not getting or delaying needed medical in the previous 12 months, down from 20 percent—one in five—in 2007.
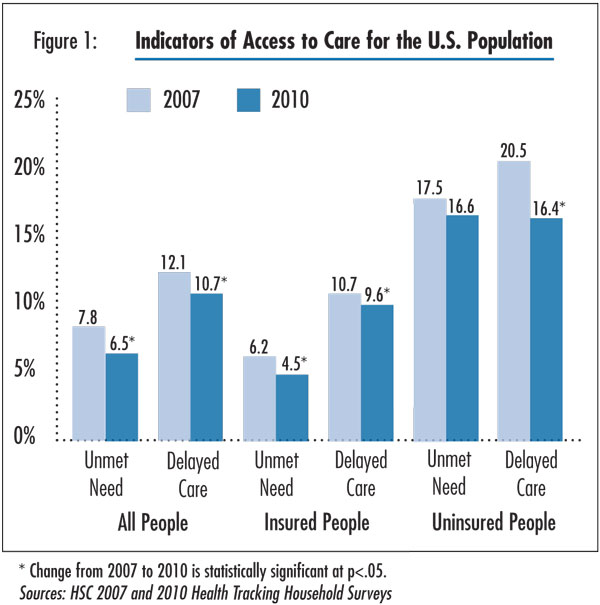
In 2010, about 19.7 million people reported going without needed care and about 32.3 million people delayed seeking care, for a total of 52 million reporting access problems, according to findings from HSC’s nationally representative 2010 Health Tracking Household Survey (see Data Source). The proportion of Americans reporting unmet needs declined by 1.3 percentage points between 2007 and 2010 (7.8% vs. 6.5%). Accounting for the increase in population, this means that about 4 million fewer people went without needed care in 2010 than would be the case if there had been no change in the rate of unmet need (see Figure 1 and Supplementary Table 1).
Declines in unmet needs among the insured population largely accounted for the overall decrease and more than offset increases in the number of uninsured with unmet medical needs. The percentage of insured people reporting an unmet medical need declined by more than a quarter—from 6.2 percent to 4.5 percent—between 2007 and 2010. At the same time, the incidence of unmet need among the uninsured fell slightly from 17.5 percent to 16.6 percent, but the change was not statistically significant. Although unmet need did not increase for the uninsured between 2007 and 2010, the gap in unmet need between insured and uninsured populations widened in 2010 compared to 2007.2
Moreover, fewer people delayed needed medical care in 2010 compared to 2007. Among the insured, the proportion that reported delaying care fell from 10.7 percent in 2010 to 9.6 percent in 2007. Uninsured individuals experienced an even steeper decline: the proportion delaying care dropped 4.1 percentage points from 20.5 percent to 16.4 percent.
Despite the recent decrease, the number and proportion of people with problems getting needed medical care were still higher in 2010 than in 2003, because of the large increase in access problems between 2003 and 2007 for both the insured and uninsured populations.3
Click here to view this figure as a PowerPoint slide.
Declining Unmet Needs, Decreasing Demand
![]() he decrease in unmet needs among insured people likely reflects both decreased demand for care and the easing of system capacity constraints. Amid the economic downturn, many people cut back on their use of health care, including doctor visits, prescription drugs and procedures.4 The Health Tracking Household Survey data show a 4 percent decrease in physician visits per person between 2007 and 2010, following an 11 percent increase between 2003 and 2007 (findings not shown).
he decrease in unmet needs among insured people likely reflects both decreased demand for care and the easing of system capacity constraints. Amid the economic downturn, many people cut back on their use of health care, including doctor visits, prescription drugs and procedures.4 The Health Tracking Household Survey data show a 4 percent decrease in physician visits per person between 2007 and 2010, following an 11 percent increase between 2003 and 2007 (findings not shown).
The recent decrease in utilization reflects increases in the number of uninsured—who use physicians much less frequently than insured people—a sharp decrease in utilization among the uninsured between 2007 and 2010, and no change for the insured between 2007 and 2010 after a rise in utilization between 2003 and 2007 (findings not shown). Decreased demand for care reduces the opportunities for people to experience access barriers. At the same time, there is freed-up capacity for people who do seek care, and they are less likely to confront obstacles, such as long appointment queues or in-office wait times. Reduced capacity constraints may be especially important in explaining the decrease in delayed care between 2007 and 2010.
Back to Top
Lower-Income and Sicker People Face More Access Problems
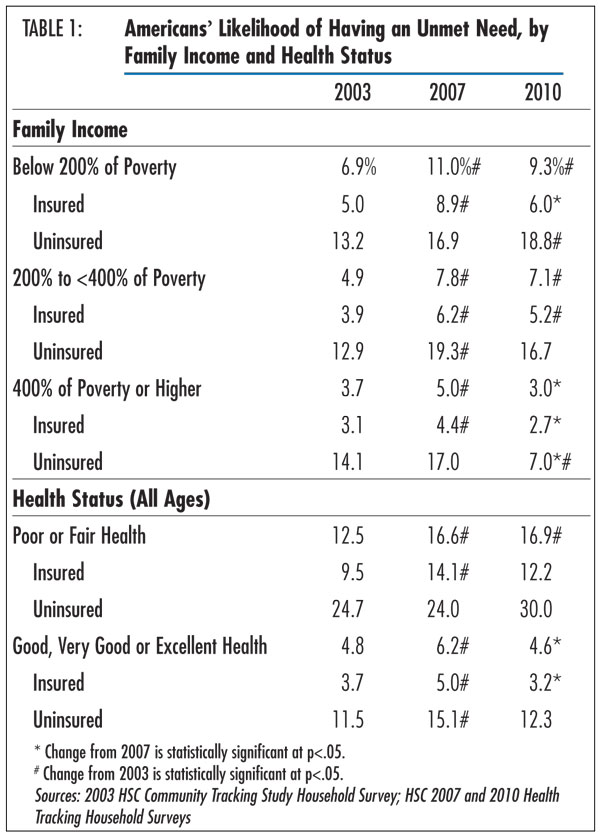
![]() nmet medical needs were greater for people with low or moderate incomes compared with higher earners, regardless of insurance status. Overall, in 2010, people with incomes below 200 percent of poverty—$44,100 for a family of four—were 3.1 times as likely to report an unmet need as those with incomes at or above 400 percent of poverty (9.3% vs. 3%). This imbalance has grown since 2007, when low-income people were only 2.2 times as likely as higher earners to forgo care (see Table 1). Between 2007 and 2010, unmet needs declined for high-income people—from 5 percent to 3 percent—but remained steady for those in the low- and moderate-income groups.5
nmet medical needs were greater for people with low or moderate incomes compared with higher earners, regardless of insurance status. Overall, in 2010, people with incomes below 200 percent of poverty—$44,100 for a family of four—were 3.1 times as likely to report an unmet need as those with incomes at or above 400 percent of poverty (9.3% vs. 3%). This imbalance has grown since 2007, when low-income people were only 2.2 times as likely as higher earners to forgo care (see Table 1). Between 2007 and 2010, unmet needs declined for high-income people—from 5 percent to 3 percent—but remained steady for those in the low- and moderate-income groups.5
Within each income group, uninsured people were roughly three times as likely as insured people to report going without needed care. Further analysis shows that the access gap between insured and uninsured people widened in 2010 for low-income people but not for moderate- or higher-income people.6
People who reported fair or poor health also were more likely to report forgoing needed medical care compared with those in good, very good or excellent health (16.9% vs. 4.6%). This is in part because sicker people tend to use more health care and, therefore, have more opportunities to encounter barriers to access. Between 2007 and 2010, unmet needs declined 1.6 percentage points—from 6.2 percent to 4.6 percent—among the healthier group and remained steady for those in fair or poor health.
However, the trends in access for the uninsured and insured diverged sharply for those in fair or poor health. Unmet needs increased for the uninsured in fair or poor health while decreasing for the insured, although these changes were not statistically significant because of small samples of persons in fair or poor health. Nevertheless, the access gap between insured and uninsured in fair or poor health widened, with unmet need 2.5 times higher for the uninsured than the insured in 2010, compared to 1.7 times higher in 2007.
Back to Top
Click here to view this figure as a PowerPoint slide.
Children’s Access Stable
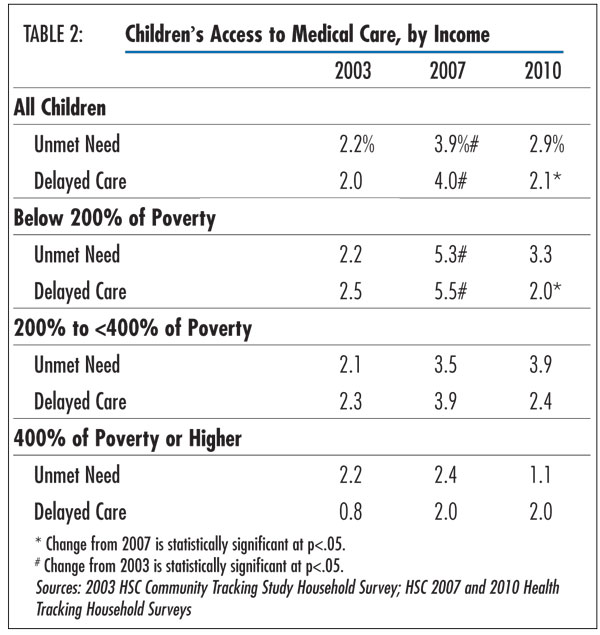
![]() hildren continued to have the fewest unmet needs among all age groups, primarily because most children are healthy and have relatively few health needs, but also because a higher proportion of children is insured. After a decline in access in the middle of the decade, children’s access improved slightly between 2007 and 2010 (see Table 2). In 2010, roughly 3 percent of children did not get needed medical care and another 2 percent delayed care, the latter estimate almost half that for 2007.
hildren continued to have the fewest unmet needs among all age groups, primarily because most children are healthy and have relatively few health needs, but also because a higher proportion of children is insured. After a decline in access in the middle of the decade, children’s access improved slightly between 2007 and 2010 (see Table 2). In 2010, roughly 3 percent of children did not get needed medical care and another 2 percent delayed care, the latter estimate almost half that for 2007.
Children in families earning 400 percent of poverty or more—$88,200 for a family of four—had the fewest access problems, with just more than 1 percent reporting an unmet need. As with the overall population, decreases in delayed care were most pronounced among children in families earning less than 200 percent of poverty. Only 2 percent of children in this income bracket delayed care in 2010, down from 5.5 percent in 2007.
Back to Top
Click here to view this figure as a PowerPoint slide.
Cost Concerns Rise, System Barriers Down
![]() mong the roughly 52 million Americans reporting an access problem, cost remained the overriding obstacle to care and has become even more of a deterrent over time. In 2010, 75 percent of people who went without or delayed needed care indicated they were worried about the cost, up 6 percentage points since 2007 (see Supplementary Table 2).
mong the roughly 52 million Americans reporting an access problem, cost remained the overriding obstacle to care and has become even more of a deterrent over time. In 2010, 75 percent of people who went without or delayed needed care indicated they were worried about the cost, up 6 percentage points since 2007 (see Supplementary Table 2).
Although uninsured people continued to express the most concern about cost, with more than 95 percent citing cost as a barrier, concerns about the cost of care increased among insured people who encountered access problems. Two-thirds of these insured individuals indicated cost concerns in 2010, up from 61 percent in 2007. Even as growth in U.S. health care spending moderated in recent years,7 spending continued to grow more rapidly than incomes, and many employers have increased patient cost sharing and reduced the comprehensiveness of coverage in response to the poor economy.8 These factors, along with increased unemployment, may have contributed to growing cost concerns among insured people.
As cost concerns became more prominent over time, health system-related concerns diminished in importance among both insured and uninsured people. More than half of insured people with an access problem reported a health system barrier in 2010, a drop of 11 percentage points from 2007. Approximately one-quarter of uninsured people encountered a system-related barrier in 2010, down 16.2 percentage points from 2007. Among all people citing a health-system obstacle, the biggest declines were associated with the following reasons (see Supplementary Table 3): inability to get an appointment soon enough (10.2 percentage point decrease); takes too long to get to the provider (6.0 percentage point decrease); inability to get to provider when the office was open (5.7 percentage point decrease); and inability to get through on the telephone (5.5 percentage point decrease).
The decline in system-related barriers between 2007 and 2010 differed markedly from developments between 2003 and 2007, when system barriers increased amid sharply higher demand for care and the resulting severely strained capacity. In contrast, the recent decrease in system-related barriers likely reflects freed-up resources stemming from a decrease in the demand for care, as discussed previously. Also, as financial concerns increase during a period of economic recession and high unemployment, individuals who decide not to seek care because of cost concerns are precluded from encountering other health insurance- or system-related barriers. For example, a patient who chooses not to call for an appointment will not have the opportunity to report difficulty finding a doctor, getting through on the phone or scheduling an appointment that is timely and convenient.
Back to Top
Implications
![]() fter a steep decline in access to medical care between 2003 and 2007, Americans’ access to care stabilized in 2010 for both children and adults. However, the overall trend obscures the fact that the access gap between insured and uninsured people increased between 2007 and 2010, especially among low-income people and those with health problems.
fter a steep decline in access to medical care between 2003 and 2007, Americans’ access to care stabilized in 2010 for both children and adults. However, the overall trend obscures the fact that the access gap between insured and uninsured people increased between 2007 and 2010, especially among low-income people and those with health problems.
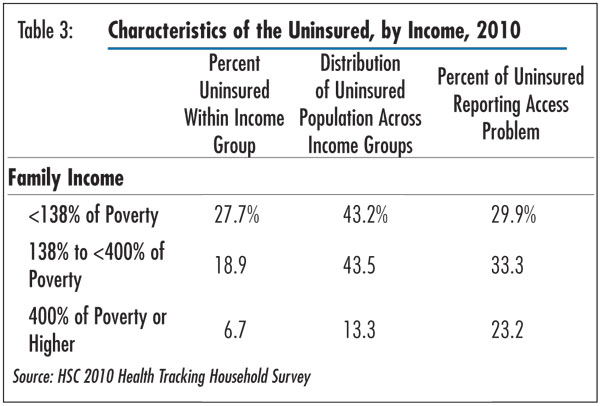
Under the 2010 Patient Protection and Affordable Care Act (PPACA), Medicaid eligibility will expand to include people earning up to 138 percent of poverty and subsidies will be available to people earning less than 400 percent of poverty to purchase coverage in health benefit exchanges starting in 2014. This study’s findings indicate that these provisions do indeed target populations that disproportionately experienced access problems in 2010. Uninsurance rates were highest for low and moderate earners and, among the uninsured, more than 86 percent fell below 400 percent of poverty (see Table 3). Moreover, the proportion of uninsured people experiencing access problems was highest for individuals earning less than 400 percent of poverty, with 30 percent to 33 percent reporting an unmet need or delayed care. Even among uninsured people in the highest income bracket, nearly one-quarter reported an access problem, indicating that access problems were not limited to the poorest uninsured.
Because uninsured and low-income people are more likely to seek low- or no-cost care, the rise in unmet needs among these groups may suggest a strain on safety net resources. Recent HSC research indicates that patient demand for safety net services surged during the economic downturn as more people became uninsured or enrolled in Medicaid.9 Yet, to a large extent community health centers and safety net hospitals were able to absorb this additional demand because of support from federal stimulus dollars. Increases to the federal medical assistance percentage, or FMAP, for state Medicaid programs; enhanced Medicaid disproportionate share hospital, or DSH, payments to hospitals serving a large percentage of low-income and Medicaid patients; maintenance-of-effort requirements that states receiving federal stimulus funding maintain Medicaid eligibility standards; and increased grants to federally qualified health centers helped relieve pressures on local and state budgets that might otherwise have led to more severe safety net cuts. In the absence of these initiatives, it is possible that access would have declined more dramatically for vulnerable groups. With enhanced federal Medicaid matching funds expiring on June 30, 2011, and continuing state and local budget deficits, the loss of federal funds may lead to a rise in access problems.
While access problems decreased between 2007 and 2010, this was most likely because of an overall decline in demand for health services that loosened heath system capacity constraints for patients seeking care. During a time of economic hardship for many, patients may have become savvier and more cost-conscious health care consumers by cutting back on care, which has been observed by some providers.10 This could be a positive development to the extent that patients cut back on wasteful or duplicative care, but a much greater concern if patients also cut back on necessary tests, procedures and treatments. Sustained reductions in demand could put downward pressure on health care costs and help to bend the cost curve, but ideally this reduced demand would be greater for services of limited value to health and health outcomes.
It is likely that much of the decrease in demand represents a temporary change in response to strained finances during the recession. As the economy strengthens, demand for care will increase. Moreover, as the PPACA coverage expansions are implemented in 2014 and many gain health coverage, system-related access problems may increase as pent-up demand from newly insured persons is unleashed. To ensure that needs are met, it is important for providers and policy makers to expect and take appropriate steps to avoid potential system-related barriers, especially in areas with provider shortages and where increases in health coverage will be the largest.
Back to Top
Click here to view this figure as a PowerPoint slide.
Notes
| 1. | Estimates are based on the 2007 and 2010 HSC Health Tracking Household Surveys and are broadly consistent with other national surveys, including the Current Population Survey and the National Health Interview Survey. |
| 2. | This finding is based on a weighted logistic regression analysis of the likelihood of having unmet medical needs that combined the 2007 and 2010 surveys and controlled for age, gender, family income, education, race/ethnicity and health status. Indicators for insurance status (uninsured set to 1) and survey year (2010 set to 1) were also included. An interaction term for insurance status and survey year was positive and statistically significant at the .05 level, indicating that unmet need for the uninsured relative to the insured population was higher in 2010 than in 2007. |
| 3. | Cunningham, Peter J., and Laurie E. Felland, Falling Behind: Americans’ Access to Medical Care Deteriorates, 2003-2007, Tracking Report No. 19, Center for Studying Health System Change, Washington, D.C. (June 2008). |
| 4. | Johnson, Avery, Jonathan D. Rockoff and Anna Wilde Mathews, “Americans Cut Back on Visits to Doctor,” The Wall Street Journal (July 29, 2010). |
| 5. | Results were nearly identical when defining the lowest income group as individuals earning less than 138 percent of poverty, which aligns with federal guidelines governing Medicaid eligibility under the 2010 Patient Protection and Affordable Care Act. According to the law, all adults younger than 65 will be eligible for Medicaid if their income does not exceed 133 percent of poverty, after a deduction of 5 percent based on the upper income limit for that group, effectively making 138 percent of the federal poverty level the cutoff for Medicaid eligibility. |
| 6. | These findings were based on the same analysis as described in Note 2, subsetting the samples by income level. |
| 7. | Martin, Anne, et al., “Recession Contributes to Slowest Annual Rate of Increase In Health Spending In Five Decades,” Health Affairs, Vol. 30, No. 1 (January 2011). |
| 8. | Kaiser Family Foundation/Health Research and Educational Trust, Employer Health Benefits 2010 Annual Survey (September 2010). |
| 9. | Felland, Laurie E., Joy M. Grossman and Ha T. Tu, Key Findings from HSC’s 2010 Site Visits: Health Care Markets Weather Economic Downturn, Brace for Health Reform, Issue Brief No. 135, Center for Studying Health System Change, Washington, D.C. (May 2011). |
| 10. | Johnson, Rockoff and Mathews (2010); and Abelson, Reed, “Health Insurers Making Record Profits as Many Postpone Care,” The New York Times (May 13, 2011). |
Back to Top
Data Source
This Tracking Report presents findings from the HSC 2007 and 2010 Health Tracking Household Surveys and the 2003 Community Tracking Study Household Survey. All three telephone surveys use nationally representative samples of the civilian, noninstitutionalized population. For the first time, the 2010 survey included a cell phone sample because of declining percentages of households with landline phones. Sample sizes include about 47,000 people for the 2003 survey, about 18,000 people for the 2007 and about 17,000 people for the 2010 survey. Response rates for the surveys are 57 percent in 2003, 43 percent in 2007 and a combined 35 percent in 2010 (46% for the landline sample and 29% for the cell phone sample). Population weights adjust for probability of selection and differences in nonresponse based on age, sex, race or ethnicity, and education. The weights adjust also for the increased probability of selection in cases of households using both landline and cell phones. Although all three surveys are nationally representative, the sample for the 2003 survey was largely clustered in 60 representative communities, while the 2007 and 2010 surveys were based on a stratified random sample of the nation. Standard errors account for the complex sample design of the surveys. Questionnaire design, survey administration and the question wording of all measures in this study were similar across the three surveys.
Estimates of unmet need and delayed care were based on the following two questions: (1) “During the past 12 months, was there any time when you didn’t get the medical care you needed?” and (2) “Was there any time during the past 12 months when you put off or postponed getting medical care that you thought you needed?” For those reporting either an unmet need or delayed care, follow-up questions were asked to determine why. Responses included worry about cost, problems with health insurance, problems with availability of medical providers and personal reasons, such as lack of time or procrastination. This Tracking Report includes only responses where at least one of the reasons had something to do with cost, health insurance or the health care system; responses related to personal reasons only were not considered as unmet need or delayed care. Insurance status reflects coverage on the day of the interview and includes coverage obtained through employer-sponsored and individually purchased private insurance, Medicare, Medicaid, the Children’s Health Insurance Program (CHIP), other state programs, TRICARE and other military insurance programs, and the Indian Health Service.
Funding Acknowledgement
This research was funded by the Robert Wood Johnson Foundation (RWJF). The HSC 2007 and 2010 Health Tracking Household Surveys and the HSC 2003 Community Tracking Study Household Survey used for the analysis also were funded by RWJF.
Back to Top
Supplementary Table
Supplementary Table
1: Indicators of Access to Care for the U.S. Population
Supplementary Table 2:
Reasons for Access Problems, Among People Reporting Delaying or Going Without
Needed Care
Supplementary Table 3:
Detailed Reasons for Access Problems, Among People Reporting Delaying or Going
Without Needed Care
TRACKING REPORTS are published by the
Center for Studying Health System Change.
600 Maryland Avenue, SW, Suite 550
Washington, DC 20024-2512
Tel: (202) 484-5261
Fax: (202) 484-9258
www.hschange.org