
Back in the Driver's Seat: Specialists Regaining Autonomy
Tracking Report No. 7
January 2003
J. Lee Hargraves, Hoangmai H. Pham
![]() etween 1997 and 2001, the proportion of specialists reporting more freedom to make clinical decisions that meet their patients’ needs increased significantly, much more so than among primary care physicians (PCPs), according to a new study by the Center for Studying Health System Change (HSC). Specialists now are also more likely to believe they can make clinical decisions in the best interest of their patients without reducing their income and can maintain continuing relationships with their patients to promote high-quality care. In contrast, PCPs’ views on these issues have changed little. These findings about physicians’ perceptions are likely a reflection of recent changes in man-aged
care. Responding to a strong consumer and physician backlash, health plans gave consumers a broader choice of physicians and eased restrictions on care in the late 1990s.
etween 1997 and 2001, the proportion of specialists reporting more freedom to make clinical decisions that meet their patients’ needs increased significantly, much more so than among primary care physicians (PCPs), according to a new study by the Center for Studying Health System Change (HSC). Specialists now are also more likely to believe they can make clinical decisions in the best interest of their patients without reducing their income and can maintain continuing relationships with their patients to promote high-quality care. In contrast, PCPs’ views on these issues have changed little. These findings about physicians’ perceptions are likely a reflection of recent changes in man-aged
care. Responding to a strong consumer and physician backlash, health plans gave consumers a broader choice of physicians and eased restrictions on care in the late 1990s.
- Specialists’ Clinical Autonomy Increased
- Differing Views on Continuity of Care, Communication
- Role of Managed Care Involvement
- Implications of More Specialist Autonomy
- Data Source
- Notes
- Supplementary Tables
Specialists’ Clinical Autonomy Increased
![]() ne hallmark of managed care in the mid-1990s was a strong
emphasis on primary care and tight limitations on access to specialty care.
In fact, the term, gatekeeper— a primary care physician who oversees patients’
access to specialty care—became almost synonymous with managed care. Some
managed care practices, such as requiring preauthorization for referrals or
diagnostic tests, led physicians to report less autonomy in caring for their
patients by hindering their ability to refer to specialists or to order tests.
1
ne hallmark of managed care in the mid-1990s was a strong
emphasis on primary care and tight limitations on access to specialty care.
In fact, the term, gatekeeper— a primary care physician who oversees patients’
access to specialty care—became almost synonymous with managed care. Some
managed care practices, such as requiring preauthorization for referrals or
diagnostic tests, led physicians to report less autonomy in caring for their
patients by hindering their ability to refer to specialists or to order tests.
1
Compared with their primary care colleagues, specialists were less likely during the zenith years of managed care to agree they were free to make clinical decisions that met their patients’ needs. Responding to regulatory and market pressures in the late 1990s, many health plans began easing restrictions on care and offering broader provider networks, often resulting in fewer controls on the use of medical services, which made it easier for patients to access specialists and for physicians to make referrals for tests and procedures. 2
Between 1997 and 2001, specialists’ views about patient care changed significantly. They reported having greater clinical autonomy, improved continuity of care with patients and more coordination with PCPs. Over the same period, the proportion of specialists agreeing they could freely make clinical decisions rose by 13 percentage points, from 72.7 percent in 1997 to 85.7 percent in 2001 (see Figure 1). In contrast, the percentage of primary care physicians reporting they could freely make decisions freely remained almost constant at 86 percent between the two surveys. Equal proportions of PCPs and specialists now believe they have clinical autonomy.
Specialists’ sense of increasing clinical autonomy paralleled a rise in their perception that clinical decision making would not affect their incomes. Between 1997 and 2001, the proportion of specialists agreeing they could make clinical decisions in the best interest of patients without affecting their bottom lines rose from 68.6 percent to 79.6 percent, while the corresponding proportion of PCPs reporting clinical autonomy again remained almost constant (see Table 1). The decline in capitated contracting—where managed care organizations pay physicians a fixed sum for each patient per month—probably accounts for a portion of this striking attitude shift among specialists, which was not seen among PCPs. Among those specialists with managed care contracts, the proportion deriving at least some revenue from capitation declined from 45 percent to 36.4 percent. 3 PCPs also experienced a reduction in capitation, but that decline was not as steep. In addition, restrictions on prior authorizations would likely have affected specialists’ incomes more, since they are the ones generally performing the procedures subject to authorization.
Responding to regulatory and market pressures in the late 1990s, many health plans began easing restrictions on care and offering broader provider networks, making it easier for patients to access specialists.
Figure 1
Physicians Agreeing They Have the "Freedom to Make Clinical Decisions that Meet Patients Needs"
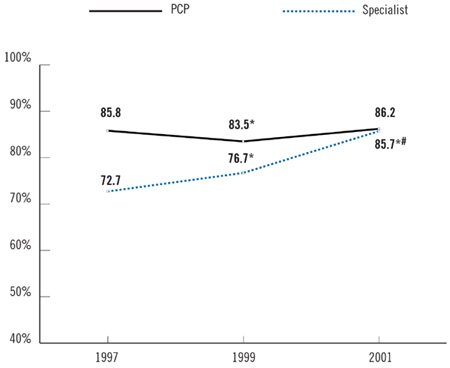
* Change from previous period is statistically significant at p<.05.
# Change from 1997 to 2001 is statistically significant at p<.05.
Source: HSC Community Tracking Study Physician Survey
| TABLE 1: Perceptions of Clinical Decision Making, Continuity, Coordination and Time with Patients Among PCPs and Specialists | |||
Percentage of Physicians Who Agree |
|||
1997 |
1999 |
2001 |
|
| Autonomy | |||
| They Can Make Clinical
Decisions in the Best Interest of Patients Without Reducing Income |
|||
| PCP | 77.4% |
76.0% |
78.8%* |
| Specialist | 68.6 |
70.7* |
79.6* # |
| All | 72.0 |
72.7 |
79.3* # |
| Continuity | |||
| They Can Maintain Continuing Relationships with Patients to Promote Quality Care |
|||
| PCP | 77.8 |
77.1 |
77.4 |
| Specialist | 57.9 |
63.3* |
73.1*# |
| All | 65.9 |
69.0* |
74.8*# |
| Communication | |||
| Communication Between PCPs and Specialists Is Sufficient to Ensure High Quality of Care |
|||
| PCP | 86.5 |
83.9* |
80.8*# |
| Specialist | 75.0 |
76.2 |
78.0# |
| All | 79.5 |
79.2 |
79.1 |
| Time | |||
| They Have Adequate Time To Spend with Patients During Typical Visits |
|||
| PCP | 66.8 |
62.2* |
58.5*# |
| Specialist | 73.0 |
66.4* |
67.0# |
| All | 70.5 |
64.8* |
63.6# |
| Note: Bold text shows that
PCPs were statistically different from specialists in the same year. * Change from previous period is statistically significant at p<.05. # Change from 1997-2001 is statistically significant at p<.05. Source: HSC Community Tracking Study Physician Survey |
|||
Back to Top
Differing Views on Continuity of Care, Communication
![]() here also are clear differences in trends in how specialists and PCPs perceive continuity of care with patients, coordination of care among referring physicians and adequate time with patients. Because specialists and PCPs perform such different roles in the health care system, it is not surprising that they consistently have different perspectives on relationships with each other and with their patients. For example, communication between them is often uneven, with the information needs of PCPs being greater than those of specialists. Communication between PCPs and specialists is one aspect of coordinated
care that leads to better quality of medical care.4
here also are clear differences in trends in how specialists and PCPs perceive continuity of care with patients, coordination of care among referring physicians and adequate time with patients. Because specialists and PCPs perform such different roles in the health care system, it is not surprising that they consistently have different perspectives on relationships with each other and with their patients. For example, communication between them is often uneven, with the information needs of PCPs being greater than those of specialists. Communication between PCPs and specialists is one aspect of coordinated
care that leads to better quality of medical care.4
While specialists consistently reported more difficulty maintaining continuing relationships with their patients than did PCPs between 1997 and 2001, there was a 15.2 point increase in the percentage of specialists who agreed they had continuity with their patients (from 57.9% to 73.1%). In contrast, there was little change in PCPs’ views on continuing relationships during this period. Although specialists are still less likely than PCPs to report continuity of care with patients, the difference between them has decreased from 20 percentage points to about 4 percentage points. Many health plans no longer require referrals for specialty care and now allow direct access, likely making it easier for patients to see specialists, which leads to better continuity of specialist care.
Other countervailing trends have appeared between specialists and PCPs. During each survey period, PCPs were more likely than specialists to believe that communication between specialists and PCPs was sufficient to ensure high-quality care. However, the percentage of PCPs who reported adequate communication declined between 1997 and 2001, while the percentage among specialists increased. Fewer managed care restrictions on direct access to specialists that allow patients to bypass PCPs may help explain these divergent trends.
Back to Top
Role of Managed Care Involvement
![]() ifferences in trends between specialists’ and primary care physicians’ perceptions of the health care system persist when considering their level of participation in managed care. Generally, physicians with lower levels of
managed care revenue reported more autonomy and continuity with patients and were more likely to believe they had adequate time with patients, compared with
physicians with higher levels of managed care participation.
ifferences in trends between specialists’ and primary care physicians’ perceptions of the health care system persist when considering their level of participation in managed care. Generally, physicians with lower levels of
managed care revenue reported more autonomy and continuity with patients and were more likely to believe they had adequate time with patients, compared with
physicians with higher levels of managed care participation.
Comparing physicians in the top third of managed care revenue with those in the bottom third 5 reveals how views among physicians most heavily involved with managed care differ from the views of those with the least managed care participation.
Specialists reported greater ability in 2001 than in 1997 to make decisions in the interest of their patients without reducing their incomes, regardless of their current participation in managed care. In 1997, 66.9 percent of specialists with the highest managed care revenue reported that decisions about patient care did not affect income negatively, compared with 72.8 percent of specialists with the lowest managed care participation. This 6 percentage point gap declined to 2 percentage points by 2001, suggesting that managed care involvement is much less important to specialists’ clinical autonomy. In contrast, PCPs with the highest and lowest involvement of managed care had a gap of 7 percentage points in 1997, which widened to 8 percentage points by 2001. 6Specialists with the most managed care reported a dramatic improvement in their ability to maintain relationships with their patients. The proportion of specialists with the highest managed care revenues agreeing they can maintain relationships increased from 53.9 percent to 71.2 percent between 1997 and 2001. Specialists with the lowest managed care revenues experienced less change (from 66.9% to 76.6%). In contrast, the proportion of PCPs with the highest or lowest managed care revenues who reported continuity with their patients did not change over the same period. Seventy-four percent of PCPs with high managed care revenues, and about 82 percent of PCPs with low managed care revenues, reported continuing relationships with patients in both 1997 and 2001.
One departure from the differing perceptions of PCPs and specialists is the relationship between lower managed care participation and physicians having adequate time with their patients. Both PCPs and specialists with the lowest managed care revenues are more likely to report having adequate time with their patients than are their colleagues with high managed care revenues. On average, physicians with low managed care participation were 10 to 12 percentage points higher in terms of reporting enough time with patients than were physicians with high managed care participation. Moreover, both categories of physicians reported a decline in adequate time with their patients. In 1997, 74 percent of PCPs and 79 percent of specialists with low managed care participation reported having adequate time, compared to 65 percent of PCPs and 74 percent of specialists in 2001.
Generally, physicians with lower levels of managed care revenue reported more autonomy and continuity with patients compared with physicians with higher levels of managed care participation.
Back to Top
Implications of More Specialist Autonomy
![]() s managed care has become less intrusive in physicians’ practices, physicians, especially specialists, report greater autonomy—a professional value associated with more satisfaction in practicing medicine and an expectation among physicians that greater autonomy leads to better patient care.7 However, these gains are not without costs.
Loosened care management restrictions, increased enrollment in health plans that allow patients to see specialists without referrals and reduced capitated contracts are already likely resulting in increases in health care use,
medical costs and insurance premiums. Higher premiums will lead to some people becoming uninsured, and care for those persons will become worse. Another cost will be some of the gains in coordination and communication between primary care and specialist physicians that managed care is believed to have fostered.
s managed care has become less intrusive in physicians’ practices, physicians, especially specialists, report greater autonomy—a professional value associated with more satisfaction in practicing medicine and an expectation among physicians that greater autonomy leads to better patient care.7 However, these gains are not without costs.
Loosened care management restrictions, increased enrollment in health plans that allow patients to see specialists without referrals and reduced capitated contracts are already likely resulting in increases in health care use,
medical costs and insurance premiums. Higher premiums will lead to some people becoming uninsured, and care for those persons will become worse. Another cost will be some of the gains in coordination and communication between primary care and specialist physicians that managed care is believed to have fostered.
Society will continue to search for ways to improve physicians’ abilities as professionals to provide better patient care while limiting the costs of these steps. It is increasingly clear that patients and specialists prefer looser managed care. It is less clear, however, that patients, employers and taxpayers are willing to pay for completely unmanaged health care. Therefore, the current balance among access, specialist autonomy and cost is likely to shift again soon.
The current balance among access, specialist autonomy and cost is likely to shift again soon.
Back to Top
Data Source
![]() his Tracking Report presents findings from the HSC Community Tracking Study Physician Survey, a nationally representative telephone survey of physicians involved in direct patient care in the continental United States conducted in 1996-97, 1998-99 and 2000-01. For discussion and presentation, we refer to a single
calendar year of the survey (1997, 1999 and 2001). The sample of physicians was drawn from the American Medical Association and the American Osteopathic Association master files and included active, nonfederal, office-and
hospital-based physicians who spent at least 20 hours per week in direct patient care. Residents and fellows were excluded. Each round of the survey contains information on about 12,000 physicians, and the response rates ranged from 59 percent to 65 percent.
his Tracking Report presents findings from the HSC Community Tracking Study Physician Survey, a nationally representative telephone survey of physicians involved in direct patient care in the continental United States conducted in 1996-97, 1998-99 and 2000-01. For discussion and presentation, we refer to a single
calendar year of the survey (1997, 1999 and 2001). The sample of physicians was drawn from the American Medical Association and the American Osteopathic Association master files and included active, nonfederal, office-and
hospital-based physicians who spent at least 20 hours per week in direct patient care. Residents and fellows were excluded. Each round of the survey contains information on about 12,000 physicians, and the response rates ranged from 59 percent to 65 percent.
Back to Top
Notes
| 1. | Stoddard, Jeffrey J., J. Lee Hargraves, Marie Reed and Allison Vratil, "Managed Care, Professional Autonomy, and Income: Effects on Physician Career Satisfaction," Journal of General Internal Medicine, Vol. 16, No. 10 (October 2001). |
| 2. | Draper, Debra A., Robert E. Hurley, Cara S. Lesser and Bradley C. Strunk, "The Changing Face of Managed Care," Health Affairs, Vol. 21, No. 1 (2002). |
| 3. | Strunk, Bradley C., and James D. Reschovsky, Kinder and Gentler: Physicians and Managed Care, 1997-2001, Tracking Report No. 5, Center for Studying Health System Change, Washington, D.C. (November 2002). |
| 4. | Forrest, Christopher B., et al., "Coordination of Specialty Referrals and Physician Satisfaction with Referral Care," Archives of Pediatric Adolescent Medicine, Vol. 154, No. 5 (2000); Gandhi, Teja, K., et al., "Communication Breakdown in the Outpatient Referral Process," Journal of General Internal Medicine, Vol. 15, No. 9 (2000). |
| 5. | Physicians were ranked by specialty, according to the percentage of their practice’s revenue from managed care. To measure managed care participation relative to physician peer groups, the study separately compared managed care participation within medical specialists, surgical specialists, psychiatric specialists, etc. Levels of managed care revenue for 1997, 1999 and 2001 for groups of physicians are available at www.hschange.org/CONTENT/512/?supp=3. |
| 6. | Results of analysis of managed care associated with physician views of autonomy, coordination and continuity are available at www.hschange.org/CONTENT/512/?supp=1. |
| 7. | Stoddard et al., op. cit. |
Back to Top
Supplementary Tables
Supplementary Table
1: Clinical Decision Making, Time with Patients and Continuity and Coordination
Among Physicians with Low or High Participation in Managed Care
Supplementary Table 2:
Managed Care Participation and Practice Ownership Among PCPs and Specialists,
1997-2001
Supplementary Table 3:
Physicians’ Participation in Managed Care, 1997-2001
Supplementary Table 4:
Clinical Decision Making, Time with Patients and Continuity and Coordination
Among Medical and Surgical Specialist Physicians, 1997-2001
Supplementary Table 5:
Clinical Decision Making, Time with Patients and Continuity and Coordination
Among Specialist Physicians with Low or High Participation in Managed Care
TRACKING REPORTS are published by the Center for Studying Health System Change.
President: Paul B. Ginsburg
Contact HSC at:
600 Maryland Avenue, SW Suite 550
Washington, DC 20024-2512
Tel: (202) 554-7549 (for publication information)
Tel: (202) 484-5261 (for general HSC information)
Fax: (202) 484-9258
www.hschange.org